Methods
Summary
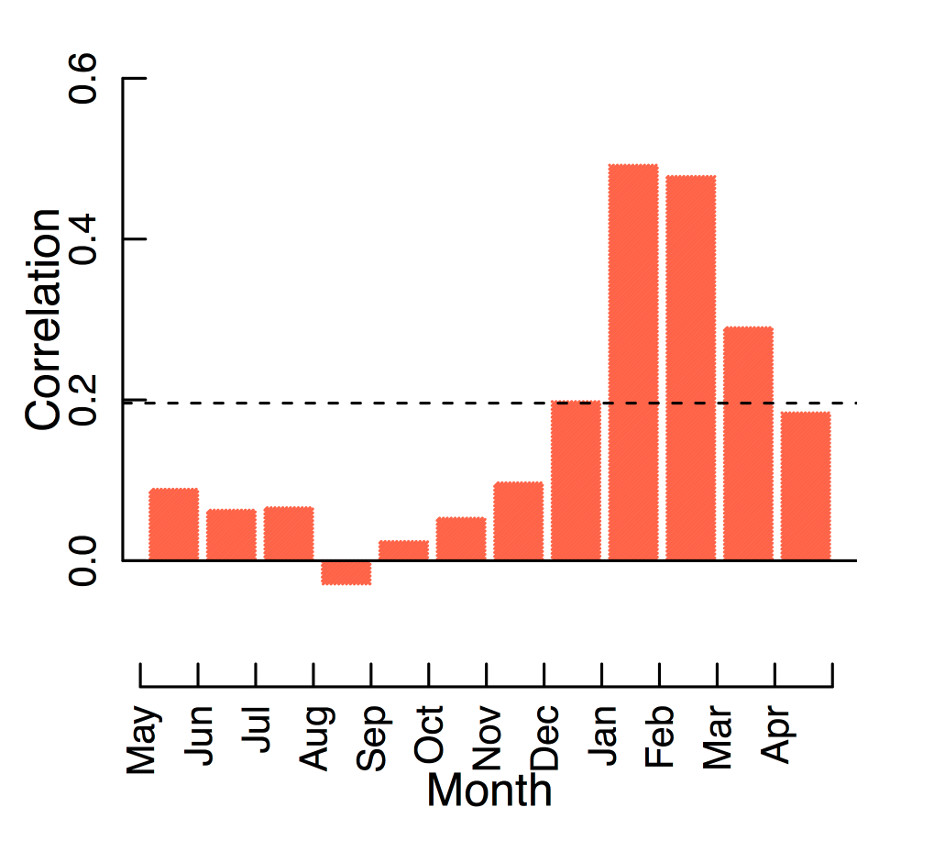
We will use standard dendrochronological methods to develop our tree-ring chronologies from the raw data we already have. Once these chronologies have been developed, we will use local climate data to determine, via correlation analyses, the climate variables that the different chronologies respond most strongly to, and the season in which this strongest response occurs (not all tree-ring chronologies, for example, will reflect summer temperatures most strongly, and in fact, some better reflect winter temperature or the hydroclimate of their region). This will enable us to determine what sorts of extreme events are captured by different tree-ring chronologies in different regions. The plot below shows monthly correlations between one chronology in western Tasmania (Australia) and its relationships with mean temperature.
 Monthly correlations between mean temperature and Huon Pine site in western Tasmania, Australia. The dotted line shows the value at which correlations are considered statistically significant ( p < 0.05). There is a positive association between temperature and growth at this site. Therefore, trees at this site will be able to tell us about what summers were like, but not winters. So, we would use this site to look at whether summers in this region were really cold (and in this area, that usually also means wet), or very warm.
The next phase of the project will require us to develop a statistical criteria for defining what an extreme event is. Some of the ways this might be done are: 1. look at values in the chronology that are a defined number of standard deviations away from the mean; 2. Look only at chronology values in the lowest or highest 5% (for example) of chronology values; 3. Use the raw data from each chronology to define 'signature years' years - years that stand out for their narrowness, wideness, or other characteristics.
Subsequent to this, we will need to translate the defined events into mappable data. To do this, we will need to match metadata on site location, species and chronology type (eg. ring width, cell diameters,density, cell wall thickness) with chronologies and develop the relevant code to map identified events for each year. We will make use of similar software used previously to produce the Australia New Zealand Drought Atlas (ANZDA; see video below) to produce these maps. It will be these maps that will be posted on our website.
Challenges
The biggest challenge in this project will be determining what constitutes an extreme event in the tree-ring chronologies. During the first of our one-week workshops, we will use at least three different ways to identify extreme event seasons in tree-ring chronologies and compare the outcomes of these different methods with events recorded in the 20th-21st Century instrumental record. We will use the method that more closely represents the instrumental record. The translation of our series of maps to our website in a timely fashion will be a further challenge. To mitigate the risk of this process taking too long and being too difficult, we will make use of University IT resources.
Pre Analysis Plan
Once we have developed our maps, we will be able to see years in which various sites indicated extreme events. Given the information in the available literature concerning the spatial signatures of different ocean-atmosphere processes on the climate of our region, we should be able to begin to identify what sorts of processes are likely to have produced the spatial distribution of extreme events, and the sign (+ or -) in the tree-ring chronologies across southeastern Australia and New Zealand. We will begin with an examination of years identified for the 20th and 21st Centuries for which instrumental data is available.
Protocols
This project has not yet shared any protocols.