Methods
Summary
We have perfected the RFID tagging procedure over the past two years. Now it's just a matter of getting data from all of the locations we have...
We first select locations to place managed colonies of bumblebees. These colonies act as a proxy for other wild bumblebees, as we use a species that is native to Wisconsin. We use managed colonies because they can be easily located wherever our sites need to be. A total of 18 different sites will be used in this study spanning a gradient of all different types of land-use in southern Wisconsin. We have 6 "natural" sites, 6 "urban sites, and 6 "agricultural" sites. All of these different site types vary in the amount of food the have for bees, as well as how they are physically structured. If bee foraging patterns are consistently different among these different site types, we will be able to determine what is driving these differences. The sites for our 2016 field work have already been selected.
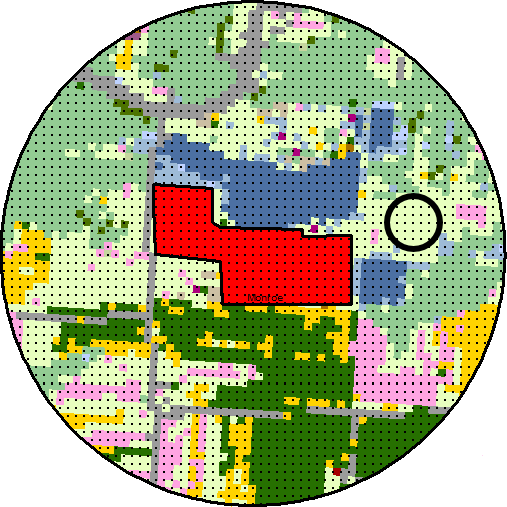
 An example of different sites used in the 2015 study in Wisconsin Cranberry marshes.
In late May, we will deploy the bumblebee colonies to the field sites. They are set out and protected from extreme heat and moisture. The RFID tracking equipment is affixed to the entrances to the colonies so that bees entering and leaving will be recorded and logged, almost as if they were passing through a miniature I-Pass system on the Illinois tollway.
Bees within each colony will be tagged regularly throughout the field season from June-September, tracking the duration of each individual trip made.
While this is being done, we also take measurements of the landscape surrounding each bumblebee colony regarding the food resources available to them. We will determine the percent of the landscape having flowers for bees (their food source), how the landscape is constructed (different types of land-uses, how "simple" or "complex" the landscapes are, distance to food resources). These data are recorded by painstakingly surveying the surrounding areas based on how the land is used. For example, we survey forests, grasslands, pastures, crop field edges, road edges, wetlands, developed areas, shrublands, etc. to determine how many flowers are there, how far they are from the bees, etc.
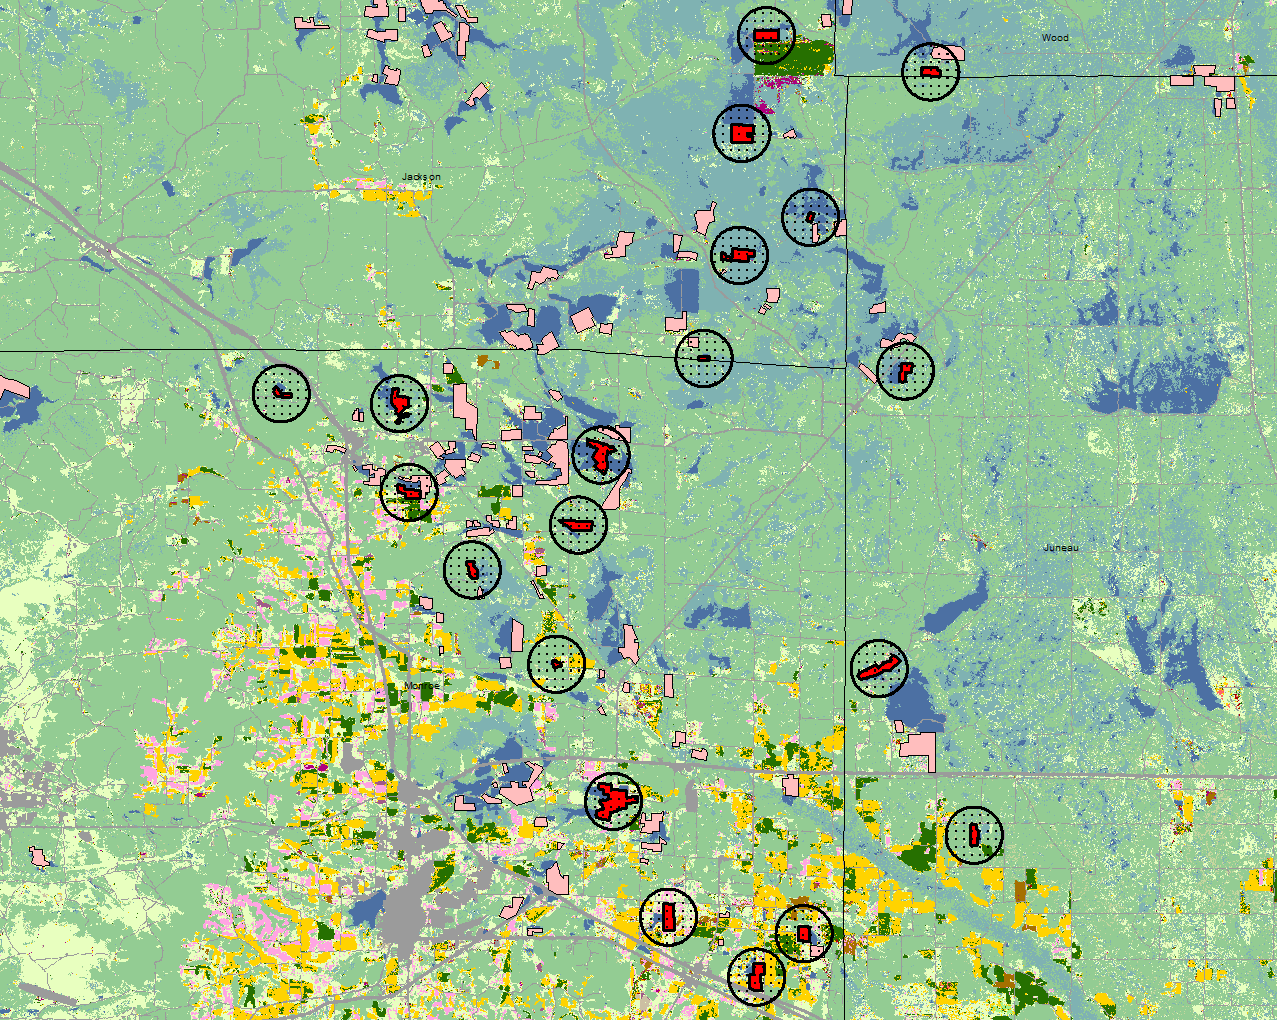
 The area surround the bumblebee colonies is quite varied. The different colors on this map figure depict different "land-uses" - including natural and managed lands. These data are provided by the USDA's Cropland Data Layer (http://nassgeodata.gmu.edu/CropScape/)
Once we have the foraging data, we relate it to to the variables that we recorded from the landscape to see if there are any strong correlations between foraging time and landscape. From these, we can determine the most important aspects of the landscape that could be driving bee foraging behavior and determine if the relationships observed at one site are consistent with those observed at another.
We also collect and dissect the colonies at the end of the experiment to determine how successful they were in their respective environments. We record how many workers the produce, how much weight they gain, and how physically large the colonies get (via volume). These data give us additional insight into how each of the different landscapes affect wild bees.
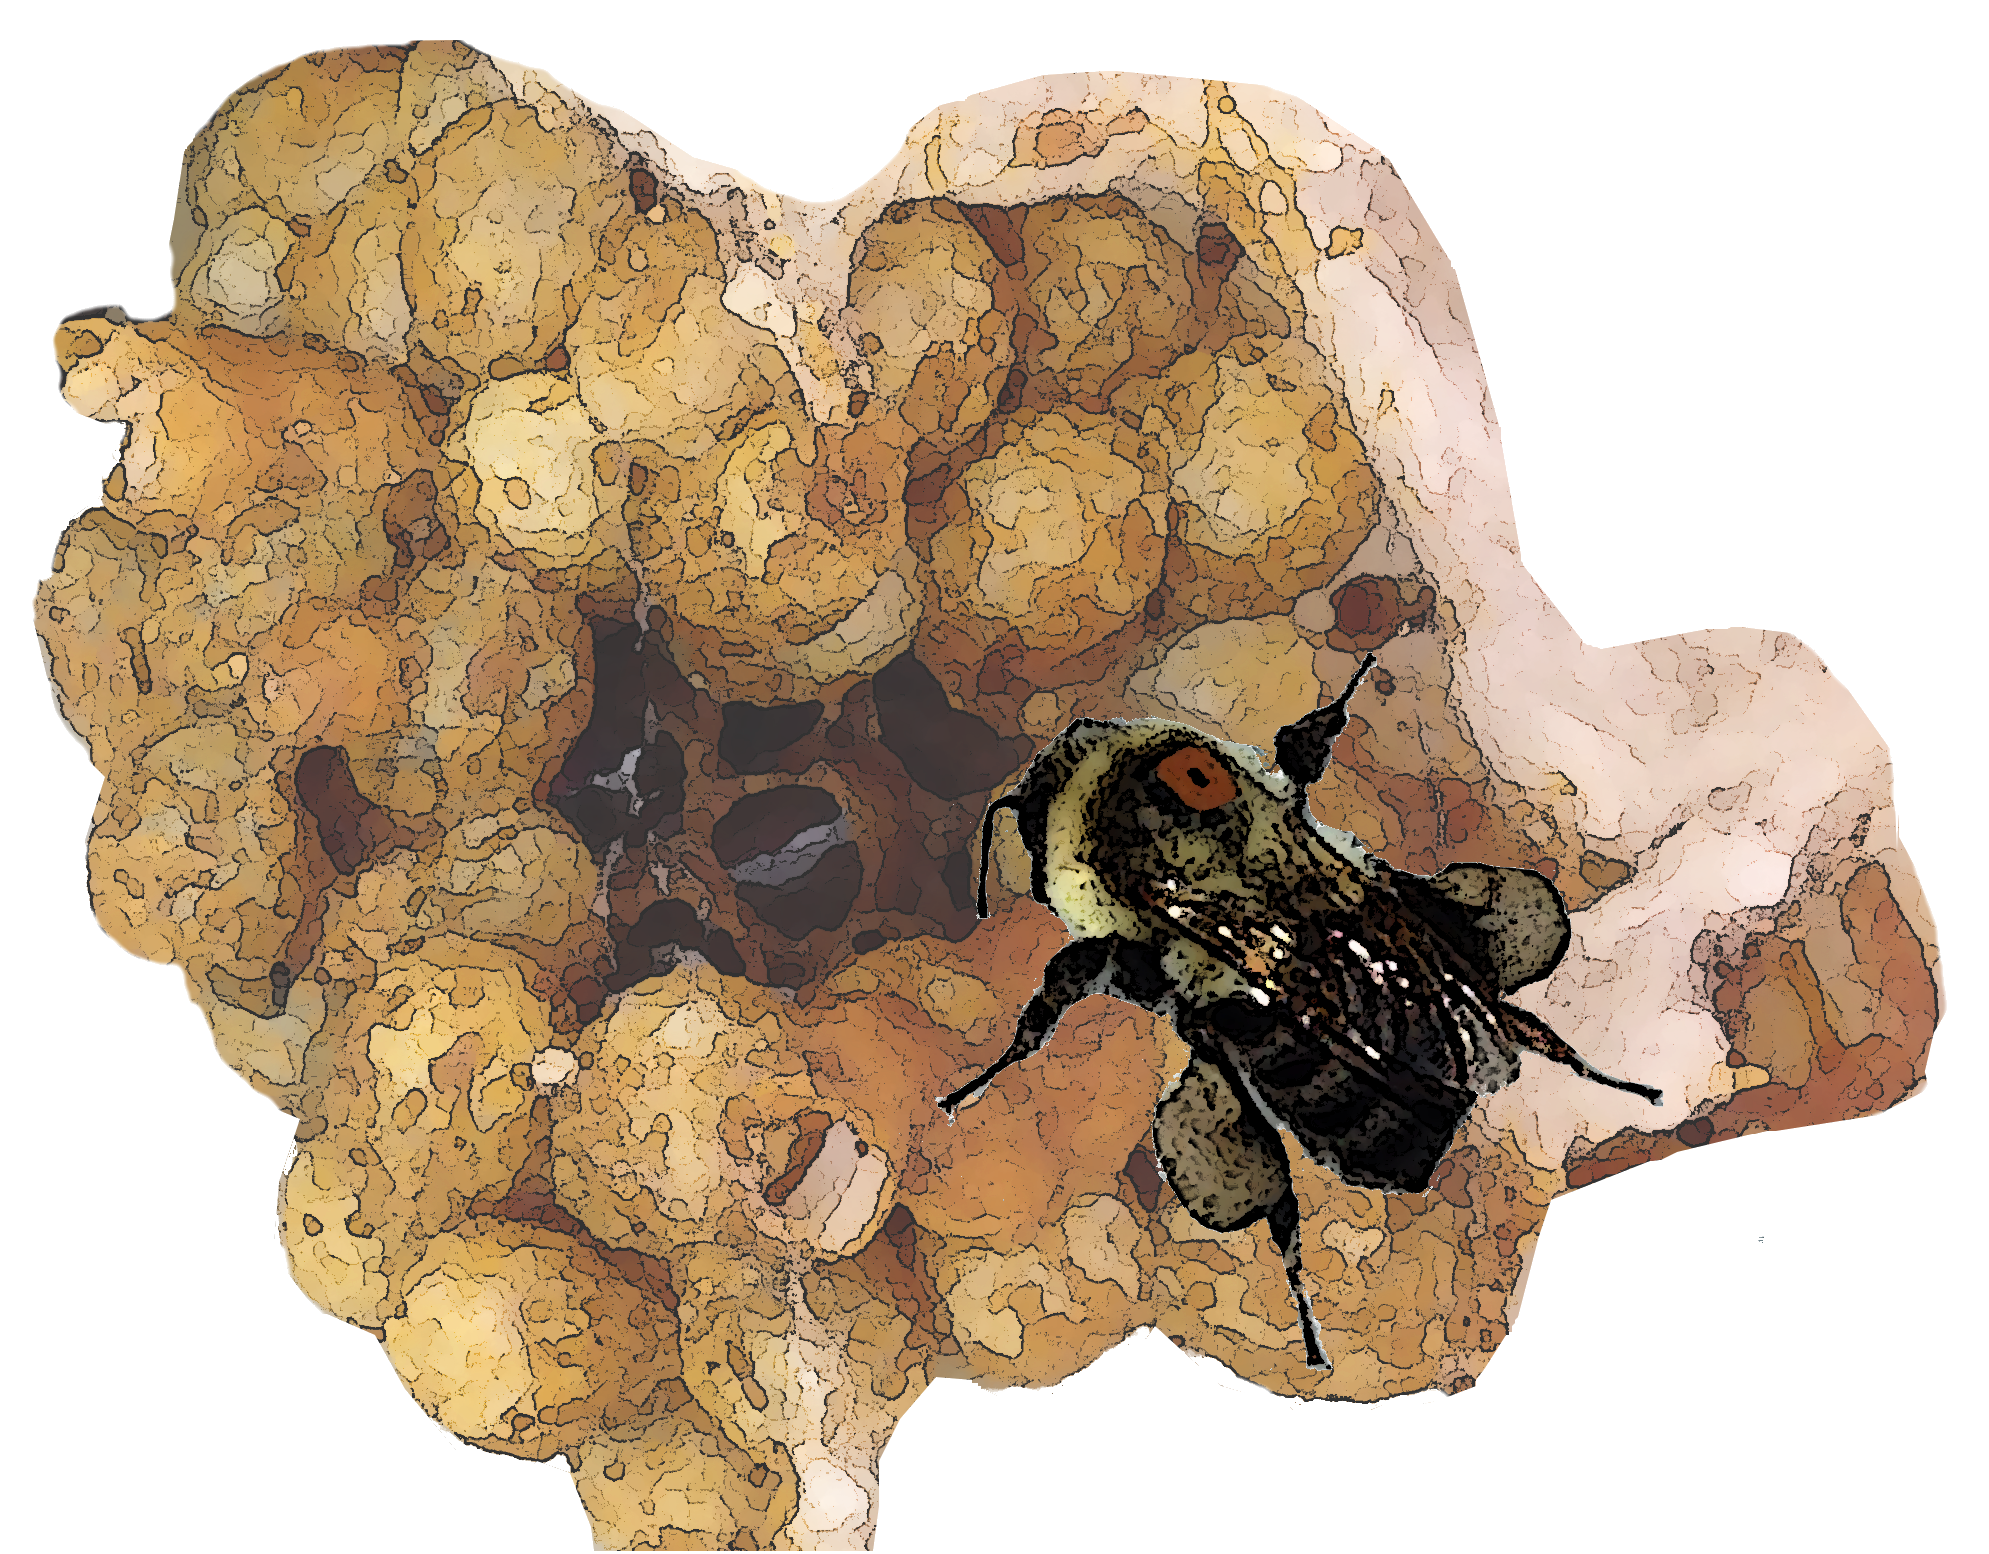 Cartoon version of a tagged bumblebee on the wax clusters of a bumblebee nest. Knowing how big the colonies get as well as how many workers they are producing helps us understand how healthy they are.
Challenges
The biggest challenge is keeping the bumblebee colonies happy and healthy for the duration of the experiment. Other insects such as beetles, moths, and arachnids like mites can invade the colony and cause issues with the developing larvae. Additionally, too humid of conditions can facilitate the growth of pathogenic bacteria and fungi. To counter this, we closely monitor the conditions of the colony to ensure that they stay within the ideal range of conditions.
Another challenge we face is getting consistent data from foraging individuals at each location. To address this, we have a strict tagging schedule for each site to ensure that there are always tagged foragers providing data for us. We approach this using a "power in numbers" strategy - tagging as many bees as possible in each colony to ensure that at least some will be yielding data.
Pre Analysis Plan
Because we have had two successful pilot studies preceding this, we have the analysis down to a science! The foraging data that comes in from the colonies looks something like this:
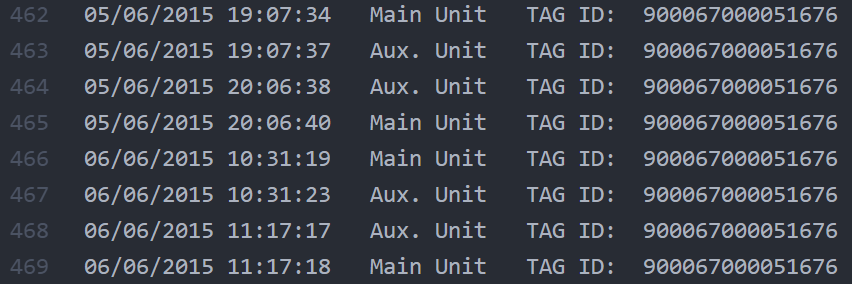
Thousands of lines of code signifying individual reads of bees. To make our data processing more streamlined, we have written a series of computer programs that mine the data looking for individual foraging trips (exit the nest - enter the nest). From this, the program gives us all of the foraging trips by each bee, the date they occurred on, and the duration.
These data will be used to explicitly test the following hypotheses:
1. Bees located in landscapes rich in resources (e.g. natural environments) will have the shortest foraging times
2. Bees located in landscapes poor in resources (e.g. urban environments) will have the longest foraging times
3. The structure of the landscape the bees reside in will affect the foraging time of individual bees - that is more complex landscapes will have shorter foraging times, while more simplified landscapes will have longer foraging times.
Given these hypotheses and the data to be collected, we will be able to determine what aspects of the landscape drive bee foraging patterns, and use those relationships to be able to predict the best habitats for bees in other areas.
Protocols
This project has not yet shared any protocols.