About This Project
Location enabled mobile devices are increasingly used to share data within the online community. Web and mobile applications facilitate the crowd-sourcing of geo-data, such as tweets, photos and map data. We analyze a great variety of data sources mined from the internet to see how people contribute to these services. The goal is to gain a better understanding of human movement, data quality and the usability of crowd-sourced data in real word applications.
Ask the Scientists
Join The DiscussionWhat is the context of this research?
GPS enabled smart phones used on Web 2.0 applications and social media platforms generate an abundance of crowd-sourced geodata, such as tweets, flood images, or digitized roads, contributed by many civil-minded enthusiasts. Quality assessment of such crowd-sourced datasets, often referred to as Volunteered Geographic Information (VGI), requires an understanding of how data from different platforms are cross-linked, and how user communities evolve across platforms. We analyzed in a conference paper the geographic overlap of data contributed to OpenStreetMap (a digital fine scale world map) and Mapillary (a collection of street level photographs). We pushed this research direction as co-organizers of a recent international workshop.
What is the significance of this project?
The participation in big data by people globally provides massive geo-datasets which can be processed, quality-controlled, and ultimately applied in facilitating emergency response, transportation modeling, participatory planning, or citizen science. Since anyone can add anything to this big data pool without any control, a major challenge to extract meaningful information is to understand how people would use these services. Analyzing contributions to several VGI and social media platforms, our project will recommend scientific methods for a better filtering of quality data from noise, and therefore, guide the proper use and analysis of crowd-sourced geodata.
What are the goals of the project?
Using an exploratory approach, the project aims to discover the advantages of analyzing patterns in multiple platforms in order to understand user behavior, as opposed to analyzing single platforms. The main goals are to determine how users participate in several services, and to provide recommendations of data use for applications that use VGI. Using already downloaded data (e.g. 4 billion geotagged tweets) and user data through Web services, we analyze spatial overlap, geographic clustering, and data volume to understand how similarly a user uses the space in different online platforms. We test if cross-referenced data have better data quality than others. We share tools with the public on GitHub, extending our previous work.
Budget
The main budget item allows us to lease server space on a commercial provider for one year to manage and analyze the massive amount of crowd-sourced data involved in this project.
The second items covers labor for setting up and maintaining a server database, integrating and analyzing crowd-sourced data from a variety of Web 2.0 applications, and developing an interactive Web portal where volunteers can share their usernames in different platforms so that we can access the contribution history of these users in different platforms.
The third item covers a supplement to publication fees in an open access journal where we plan to publish the research results of this project.
Endorsed by

Meet the Team


Levente Juhász
My interests lie in the intersection of computer science, data science and geography. I am generally interested in all sorts of open source and open data initiatives and find the whole idea fascinating. My research is mainly concerned with user behavior in online communities, data quality of user generated content and the interplay between data sources in online platforms.
Hartwig Hochmair
I am an associate professor in the Geomatics program at the University of Florida where I teach courses in GIS, Digital Mapping, Adjustment Computations, and Geodesy. In my research I specialize in Volunteered Geographic Information (VGI), bicycle and public transportation, wayfinding and navigation, and data quality. As part of my interdisciplinary research I work on analyzing the spread of invasive species in South-East Florida, including termites and tegus.
Together with my graduate students I have over the past years explored characteristics (e.g. data quality, user contribution patterns) of various VGI platforms, such as OpenStreetMap, Flickr, Panoramio, dronestagram, Mapillary, Instagram, Wikimapia, and Twitter. The fast changing field of VGI provides new challenges for analysis every day, which makes it one of my favorite research areas.
Additional Information
We already know that people use several online platforms and leave their spatial footprints behind on each of them. The figure below shows this phenomenon for a user. This figure in particular helped us to develop the initial ideas, as it clearly shows that activity spaces overlap between different services.
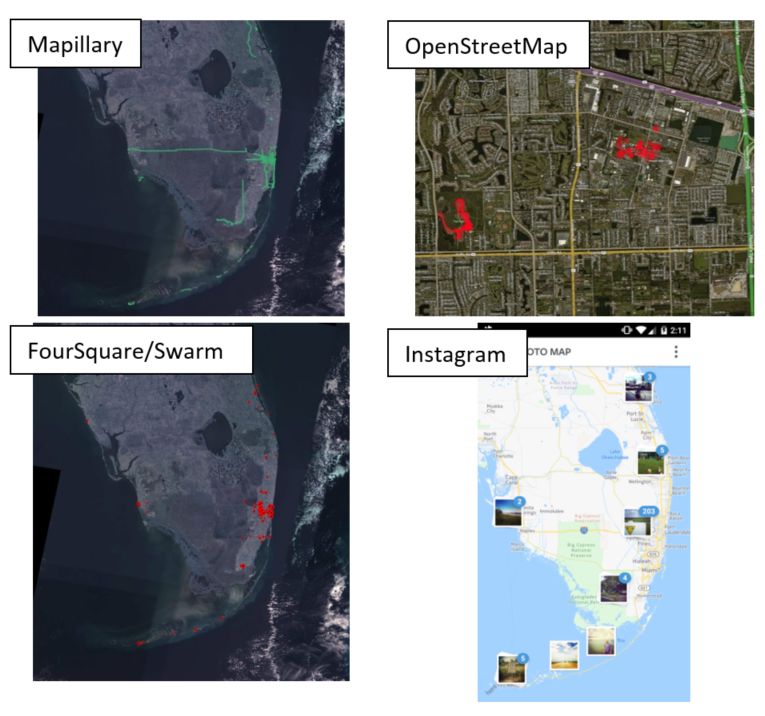
The video below shows a visualization of our exploratory experiment, showcasing two platforms with the explicit purpose of generating geographic information. Red lines indicate locations where this individual uploads street level imagery on Mapillary, whereas yellow rectangles show where this user edited OpenStreetMap. This confirmed what we already knew about spatially overlapping activity areas and made us realize that the temporal factor (that is, when those activities were recorded) also play an important role in comparing the spatial footprints of online activities between different platforms.
Project Backers
- 6Backers
- 6%Funded
- $114Total Donations
- $19.00Average Donation