Please wait...
About This Project
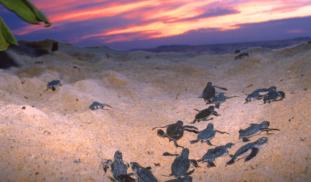
Our goal is to measure the effect of coastal light pollution on hatchling loggerhead ability to find the ocean. We hypothesize that there will be a threshold intensity above which hatchlings become disoriented and less efficient at "sea finding".
Artificial light is a pollutant which is increasing in U.S. urban environments at a rate of 6% per year. Determining hatchling response to various light levels will be important to the long term conservation strategies for endangered sea turtle species.

Browse Other Projects on Experiment
Related Projects
Out for blood: Hemoparasites in white-tailed deer from the Shenandoah Valley in Northern Virginia
Our research question centers about the prevalence and diversity of hemoparasites that infect ungulate poplulations...
Using eDNA to examine protected California species in streams at Hastings Reserve
Hastings Reserve is home to three streams that provide critical habitat for sensitive native species. Through...
How do polar bears stay healthy on the world's worst diet?
Polar bears survive almost entirely on seal fat. Yet unlike humans who eat high-fat diets, polar bears never...