Andreas Muenchow

Andreas Muenchow

Feb 08, 2015

Group 6 Copy 66
0

Sunday Afternoon of a Physical Oceanographer

Notice that temperature and salinity start only at -68 meters. This is because the ice at this location was about 68-m thick. The Big Ben clock in London is about 96-m high, but this piece if Petermann was chosen because it was less hard to drill through 2/3 of Big Ben's height when compared to drilling through the glacier ice a mile away where the ice is thicker than the Empire State Building in New York; but I digress.

The profile above reveals a pattern we find almost anywhere in deeper Arctic Waters: Temperature increases with depth. Under the ice at 68-m depth, water is at its freezing point. As you move down the water towards the bottom, salinity increases and so does temperature. It is still cold, about +0.2 degrees Celsius, but this is heat from the North Atlantic Ocean that for perhaps 20-50 years circled all the way around the Arctic Ocean from northern Norway, past Siberia, past Alaska, past Canada to reach this spot of Greenland. While this appears marvelous, and it is, this is NOT what gets a physical oceanographer excited, but this does:

It is the same data, but I did some reading, physics, algebra and code-writing in that order. First, instead of temperature, the blue line shows the temperature T and the temperature Tf above the freezing. The difference T-Tf relates to the amount of heat available to melt the ice somewhere. The black line is the real killer, though. It combines salinity and temperature observations to reveal where the glacier water resides at this location that was melted somewhere else. Without going into the physical details, glacier meltwater is present where the black line touches zero (the so-called Gade-line, so named after a Swedish oceanographer who proposed its use in 1979). This happens at a depth from about 280-m to 500-m depth. This means that the glacier is NOT melting where it is as thin as Big Ben, but instead where it is as thick as the Empire State Building. So this is where we will need to place our instruments.

Proving my initial point, I spent two hours of fun writing this blog. It originally appeared an hour ago at my blog http://IcySeas.org

0 comments

Join the conversation!Sign In

About This Project

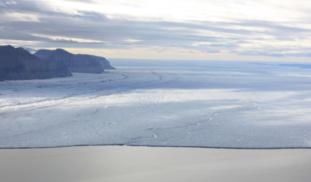
Greenland is melting and as more of its ice and water move into the ocean, sea level will rise. We will measure ocean temperature and salinity below 200 to 600 meter thick ice of Petermann Glacier in North Greenland for several years. Holes will be drilled through the ice to reach the ocean below where we place about 10 instruments. The holes will freeze over quickly, the instruments will never return, but a cable connects the mysteries of the dark ocean to the surface and via satellite to anyone with an internet connection. More details are posted at my web-log http://IcySeas.org where I share my excitement about science.

More Lab Notes From This Project

Blast off!

Browse Other Projects on Experiment

Related Projects

Innovating MOF Adsorbents for Direct Air Capture: Enhancing Stability and Efficiency for Carbon Removal

Rising CO₂ levels are a major driver of climate change, and cutting emissions isn't enough—we need to remove...

Low cost snake antivenom for Asia, Africa and South America

Death by snake venom in India, Africa, and South America are substantial. Traditional antidotes are prohibitively...

Building a low-cost DIY bioreactor system for sustainable microbial cultivation

Our project aims to develop a food-grade, low-cost, bubble column bioreactor system for easy and sustainable...

Campaign Ended

An engineering project funded by 15 people

Add a comment