Methods
Summary
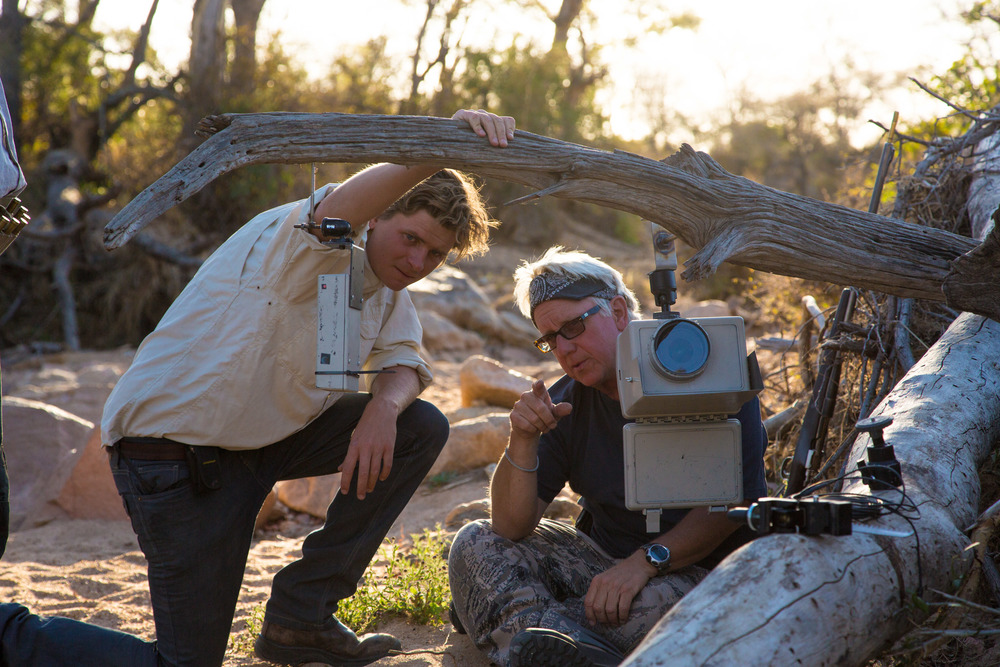
We will make use of three key population enumeration field methods, 1) photographic mark re-sight data (where individual animals are sighted, their unique markings photographed and location is recorded via GPS), 2) faecal DNA collection (droppings will be collected by myself and my team) and 3) camera-trapping (a total of 50 paired stations (100 camera-traps) will be placed in the community lands of Kitwe and within the park).
All three sets of field data (i.e. mark re-sight photographs, faecal DNA and camera-trap photographs) will be analyzed using a spatially-explicit Bayesian capture mark re-capture models (these are detailed in Broekhuis and Gopalaswamy 2016; Elliott and Gopalaswamy 2016), and because data will be collected simultaneously we will combine the different estimates under one combined model estimate according to the protocol detailed in Gopalaswamy et al (2012). All faecal DNA genotyping will be done at the Hekkala conservation genetics lab at Fordham University. We will use species-specific stool kits to extract DNA material from faecal samples (eg. QIAamp leopard kit; Qiagen INc, Valencia, CA, USA). We will follow existing literature (eg. Sugimoto et al. 2014; Uphyrhina et al. 2002) and screen DNA for species-specific markers. For example, for leopards, we will establish identity by amplifying a piece of the cytochrome b gene, while amplification of a part of the DBY gene (Y chromosome) and/or the ZFX gene (X chromosome) will be used to ascertain sex (Sugimoto et al. 2014). We will then select a series of dinucleotide microsatellite loci for individual identification from a sample reported for each of our species in the literature (eg. Uphyrina et al. 2002). All genotyping will be performed using multiplex PCR. Genotyping will be replicated at least 3-5 times and associated error rates will be noted (Broquet and Petit 2004).
The conflict assessment component of the study will make use of an occupancy modelling framework to assess conflict hotspots and the environmental variables (habitat type, distance to roads and rivers, slope and elevation; Goswami et al. 2015; Abade et al. 2014). Conflict events will be reported in a binary format (livestock depredated or not), and repeat assessments by our team will allow for the estimation of detection probability of conflict events (Goswami et al. 2015). We will overlay 4 km2 grid cells over the village lands adjoining the Queen Elizabeth National Park in a GIS environment (ArcGIS 9.3) and extract verified conflicts from each grid cell. Goswami et al (2015) grouped multiple conflict events per month into a single binary value, while absence was assigned a zero - we will follow this protocol. I will sample conflict data for a period of ten months until mid-2018. We will use the multi season occupancy models described in Mackenzie et al. (2003) and (2006) to analyze the data (a total of three seasons -- two dry, and one wet). The program MARK (White and Burnham 1999) will be used through the RDOccupEG model in RMark (Laake and Rexstad 2007). We will estimate depredation probability as well as depredation occurrence probability following Goswami et al. (2015) and also investigate the effect of our spatiotemporal covariates and how they effect conflict independently and additively (Goswami et al. 2015).
Challenges
We are working in a large game area with species such as elephants, lions, leopards and hippos. These animals are dangerous to human life, especially if encountered on foot. We will therefore always work in conjunction with a Ugandan Wildlife Authority armed scout who will accompany us in the field.
Pre Analysis Plan
The data collected in the field in Uganda in 2017 will be analyzed at the University of Queensland (Brisbane), Fordham University (New York) and the Indian Statistical Institute (Bangalore) under the guidance of Dr Arjun Gopalaswamy and Dr Evon Hekkala. Field data will be organised, filtered and analysed as the project continues with the final results being written up no later than August 2018.