Methods
Summary
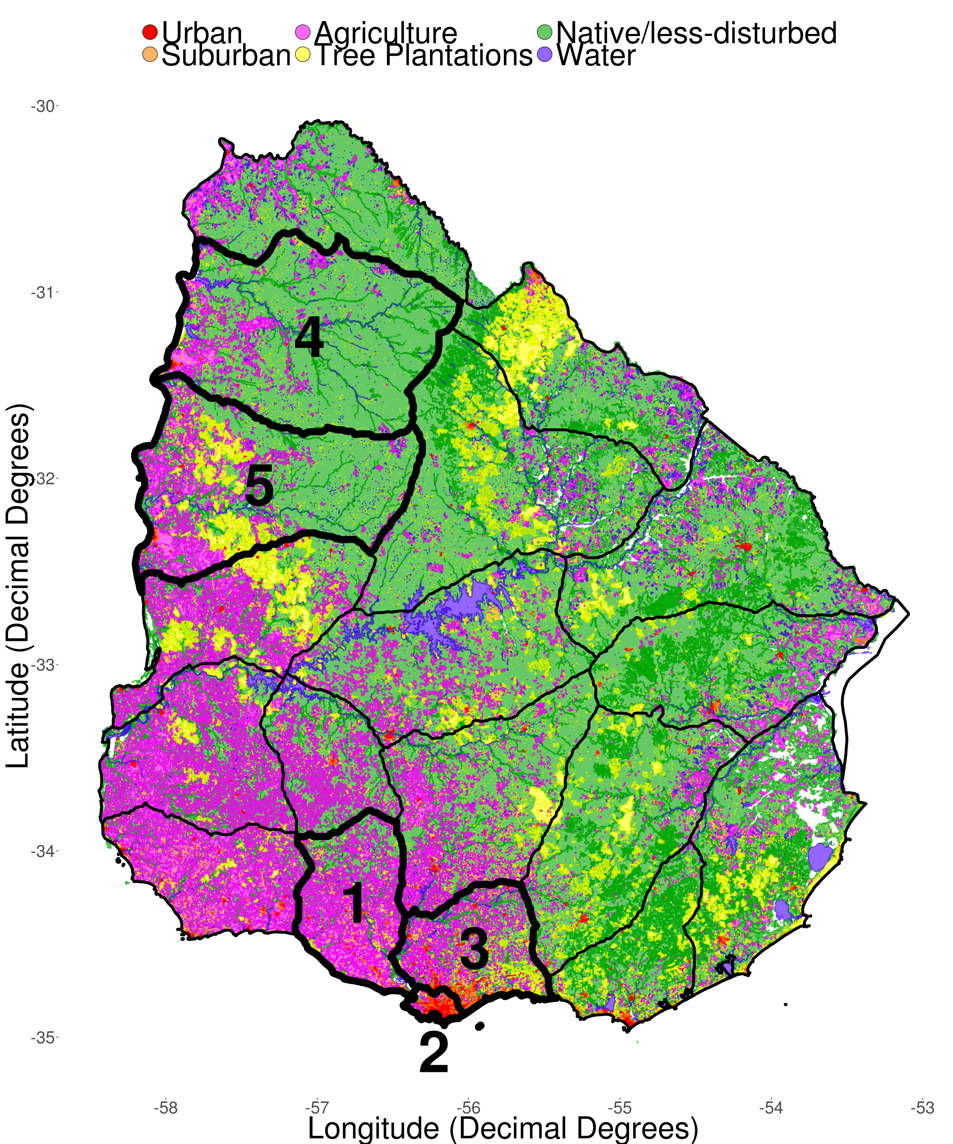
This is a land-use map of Uruguay, displaying five relevant human land-use categories. I made this map using global land cover data based on Landsat satellite imagery. Other land-use categories are in white. The counties where fieldwork will be concentrated are marked with numbers. 1 = San José, 2 = Montevideo (contains Montevideo, Uruguay’s largest city), 3 = Canelones, 4 = Salto (includes Salto, second largest city). The two groups of polygons represent latitudinal extremes in Uruguay. I will aim to set up field sites in both the regions across these human land-use categories, such that each land-use category is represented by at least one site per latitudinal extreme.
I generated a set of random points across land-use categories within each of the 5 counties shown. Upon arriving to Uruguay, I will use the first month to survey sites within this set of random points. I will need landowners' permission to access many of these sites. After landowners grant their permission, I will pick sites that have the highest densities of monk parakeet nests, then proceed with plans to capture monk parakeets and measure nest morphology/insulative capacity.
Protocols
This project has not yet shared any protocols.