Methods
Summary
Funds are being requested to support the analysis of data that has already been collected.
DATA collection:
Chinese Hamster Ovary (CHO) cells were stably transfected with cDNA coding for the human ASIC1a subunit. Outside out patches (see below) were pulled from these cells and exposed to a series of pH changes under voltage clamp conditions. The composition of the intracellular and extracellular solutions resulted in a reversal potential of +35 mV and the patches were voltage clamped at -60 mV. The resulting negative currents were recorded using an Axopatch-200B amplifier (Molecular Devices) filtered at 5KHz. The analog traces were digitized at a rate of 10 kHz using a Digidata 1440A interface and pClamp 10.2 software (Molecular Devices).
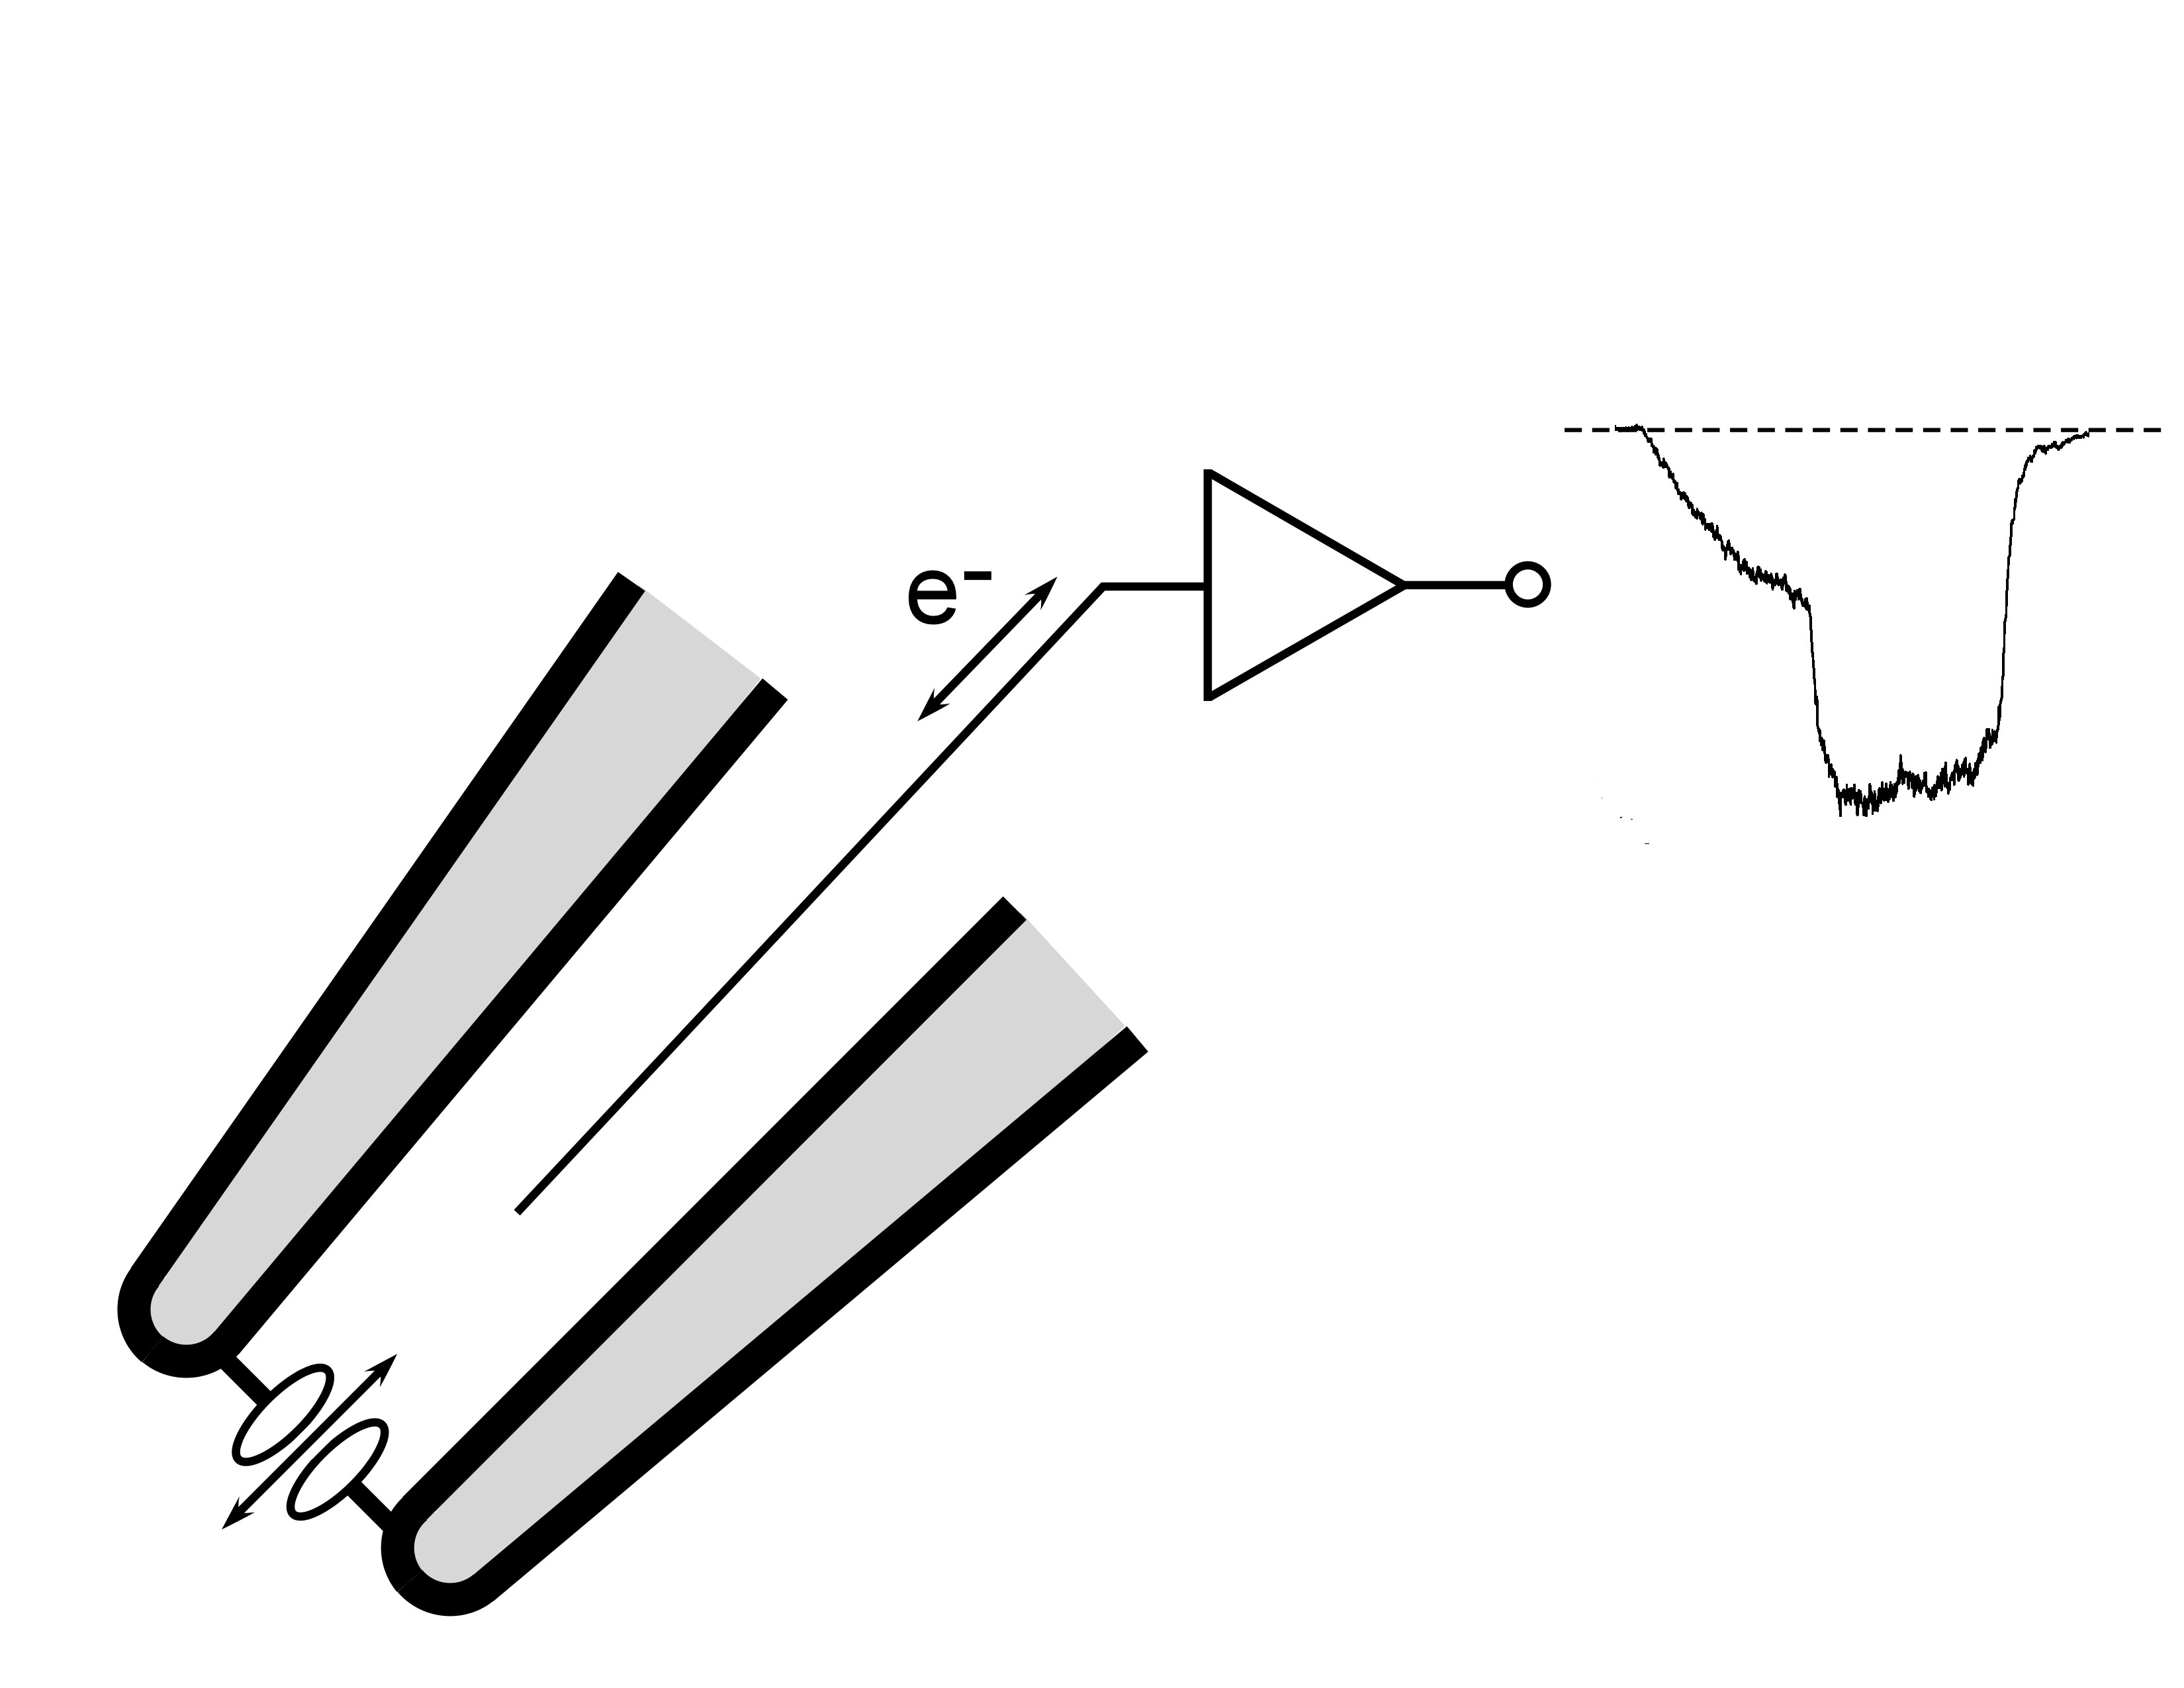
FIGURE ABOVE: A small patch of membrane is excised from a cell onto the tip of a glass electrode (shaded). As ions flow through the channels in the patch, this flow is converted to a flow of electrons by a specialized silver wire (e-). The electrical current is amplified and recorded. The trace on the right shows how the current changes with time. The dotted line is zero current, and the downward deviation shows negative current increasing and then decreasing back to zero with time.
For solution exchange, 3-barrel square glass (Warner Instruments) was pulled on a Kopf Model 710 vertical puller with a 4.5 turn Nicrome heater coil, scored with a diamond tipped pen and broken off at a tip width of 100 um per barrel. Each barrel was connected to a series of reservoirs using Polyethylene Tubing, (Warner Instruments). The 3-barrel pipette was mounted on an SF-77B stepper (Warner Instruments) which was used to expose each patch to a series pH perturbations. The 10-90% exchange times were typically between 200-800 ms.
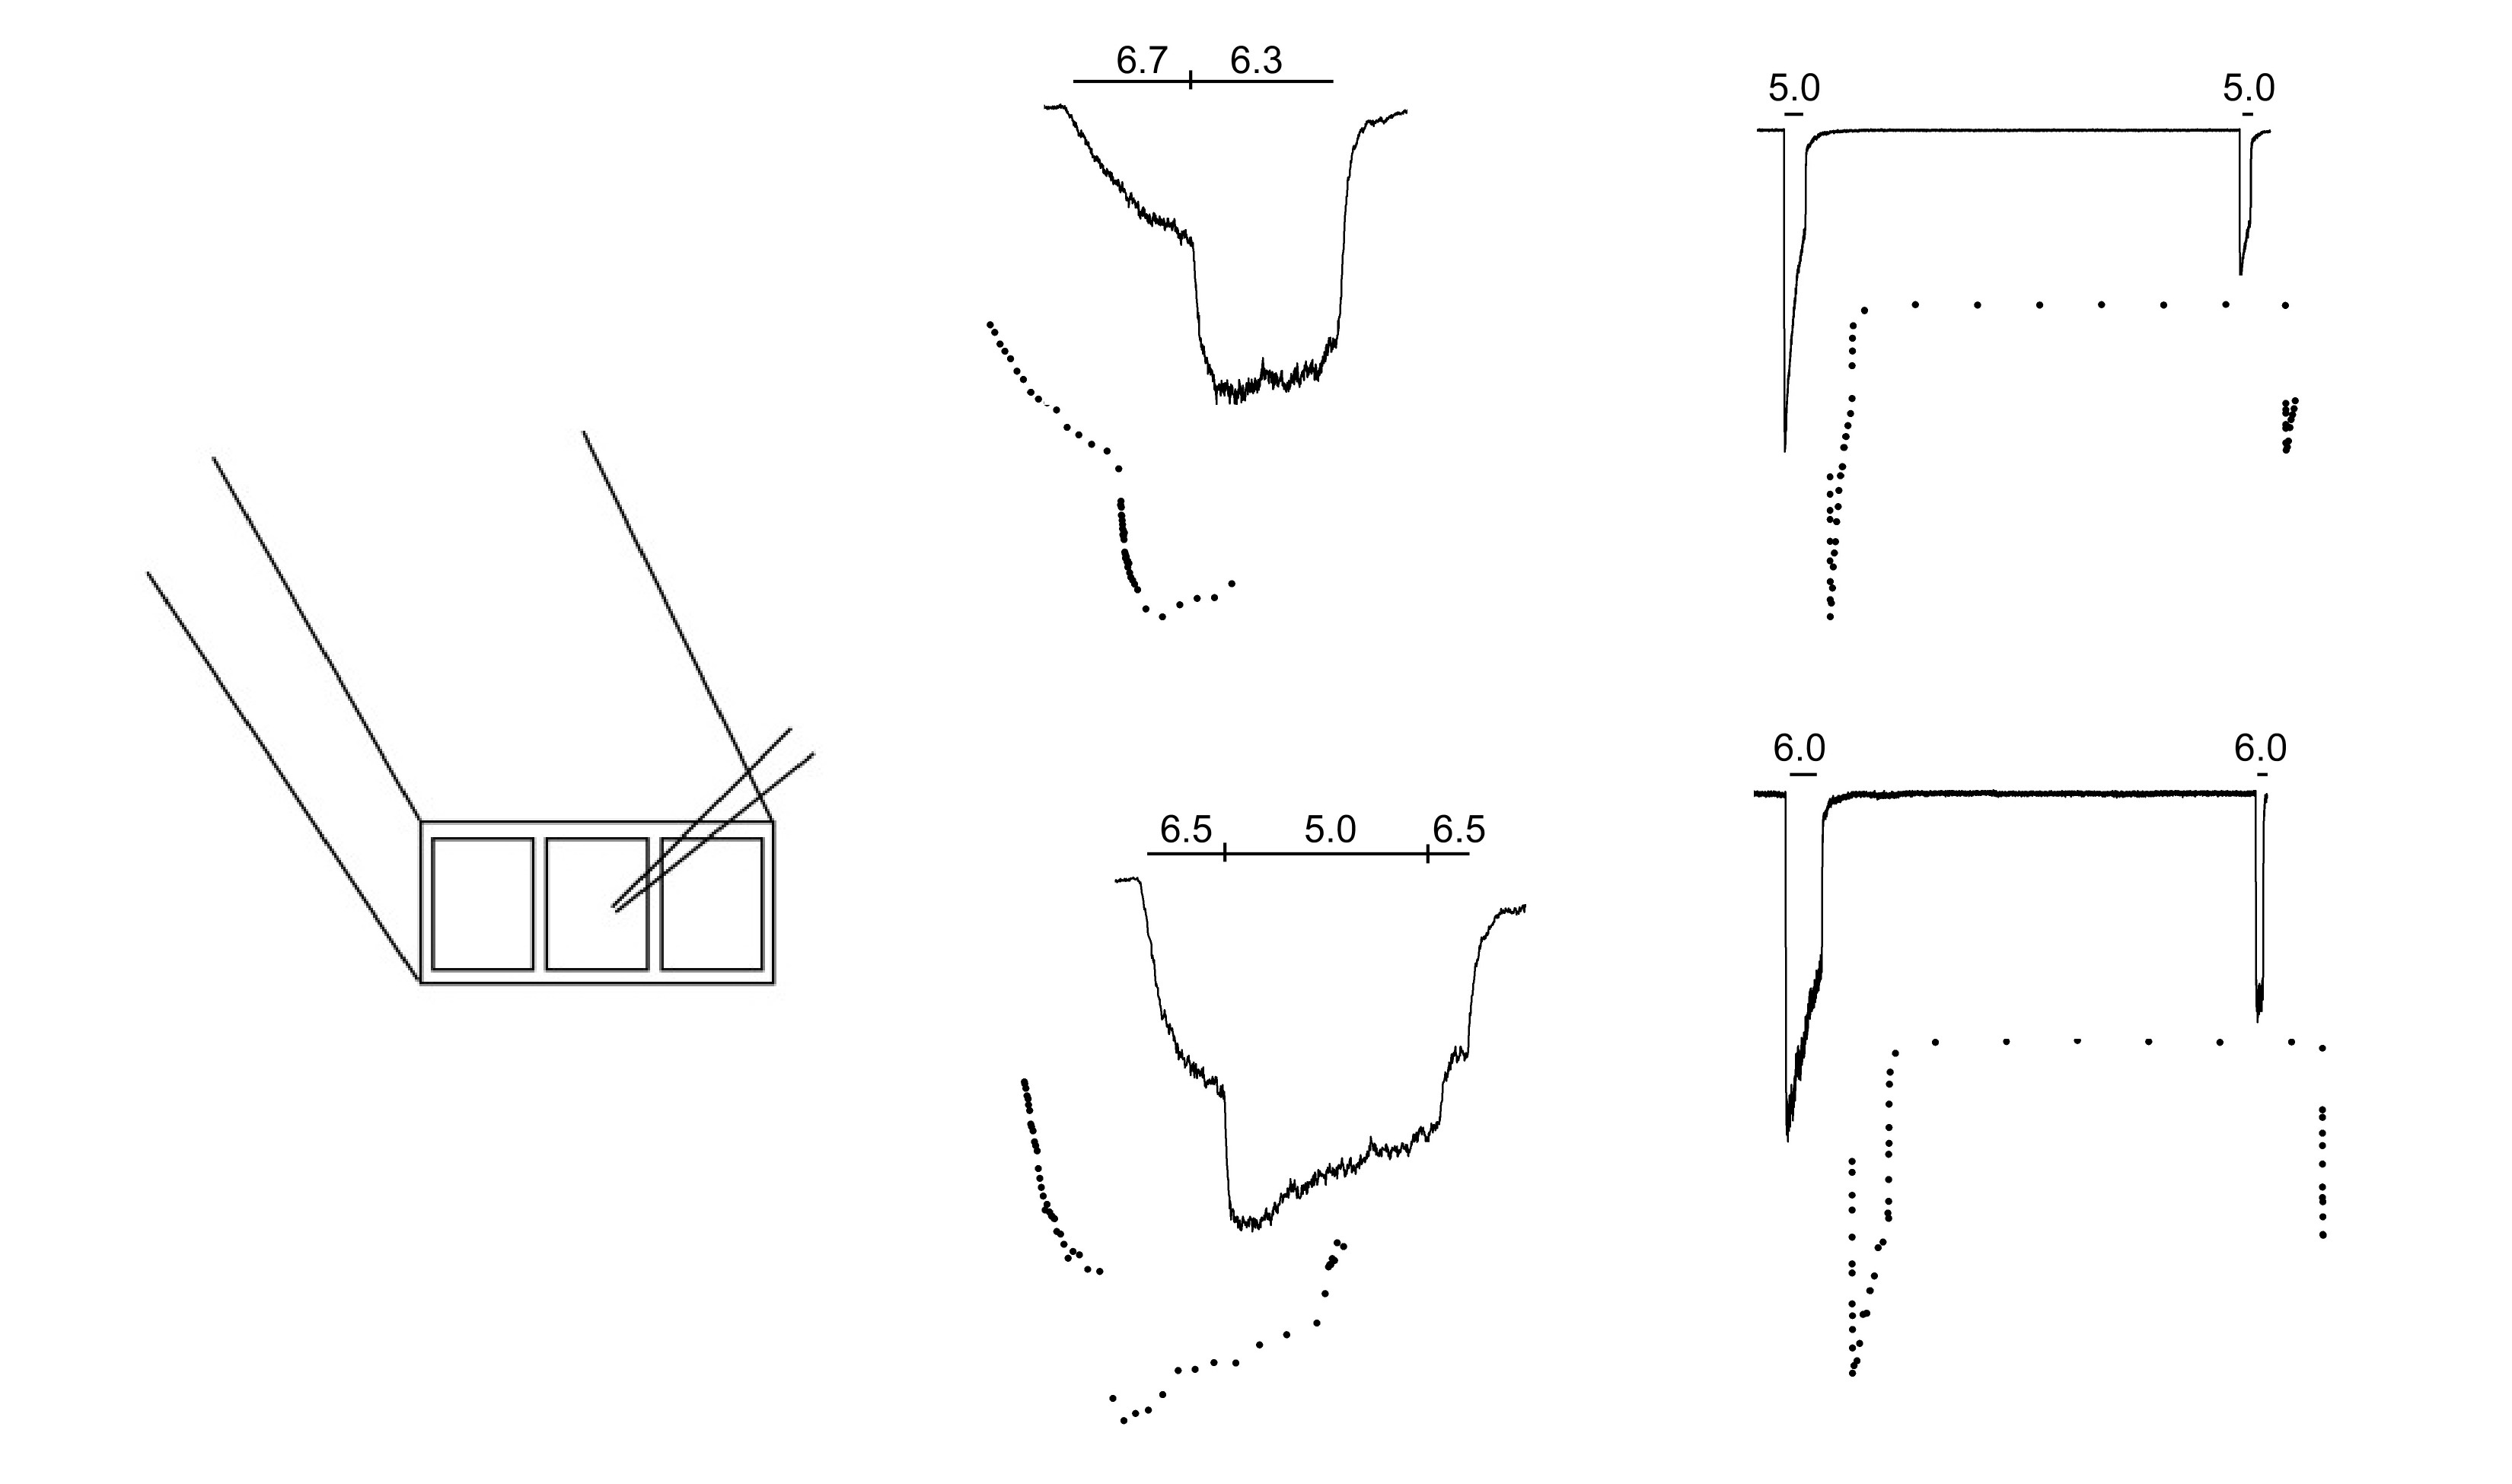
FIGURE ABOVE: Left shows the electrode positioned in front of the 3-barrel glass. As the stepper moves the 3-barrel glass, the channels at the tip of the electrode are exposed to different pH solutions. The traces on the right show how a population of several hundred channels respond to changes in pH. The lower the pH (the higher the proton concentration) the more channels open and the faster they open. Once open they begin to undergo a process of desensitization where they close despite the low pH.
Analysis:
The most powerful statistical method for extracting information from experimental data is by the use of maximum likelihood fitting. Maximum likelihood fitting has two phases, the first is to determine the nature of the theoretical model (model discrimination) and the second is to determine the value of the free parameters that make up the model. As applied to thermodynamic modeling of ion channels, model discrimination entails determining how many states the channel adopts and how they are connected. Parameter estimation entails estimating the energy levels of the different states.
At the heart of maximum likelihood fitting is the likelihood function. The likelihood function allows one to calculate the likelihood (or probability) of observing a particular data set given a particular model. For example if a coin were tossed 100 times and gave 10 heads and 90 tails, the probability of observing this (assuming a fair coin with a probability of heads of 0.5) based on the binomial equation (which is the likelihood function for any binomial data) would be on the order of 10^-17. Testing the likelihood when different values of the probability of observing a head are used, shows a maximum likelihood of 0.132 when the probability of tossing a head is 0.1. This same principal can be applied to much more complicated systems and is widely accepted as the most powerful method there can be both for discriminating between different models using likelihood ratio testing and parameter estimation through maximum likelihood fitting.
Covariance fitting is a fundamental breakthrough in ion channel research because it allows one to calculate the likelihood value for any given data set given any thermodynamic model. It opens the door to applying the power of maximum likelihood fitting to the study of ion channel function.
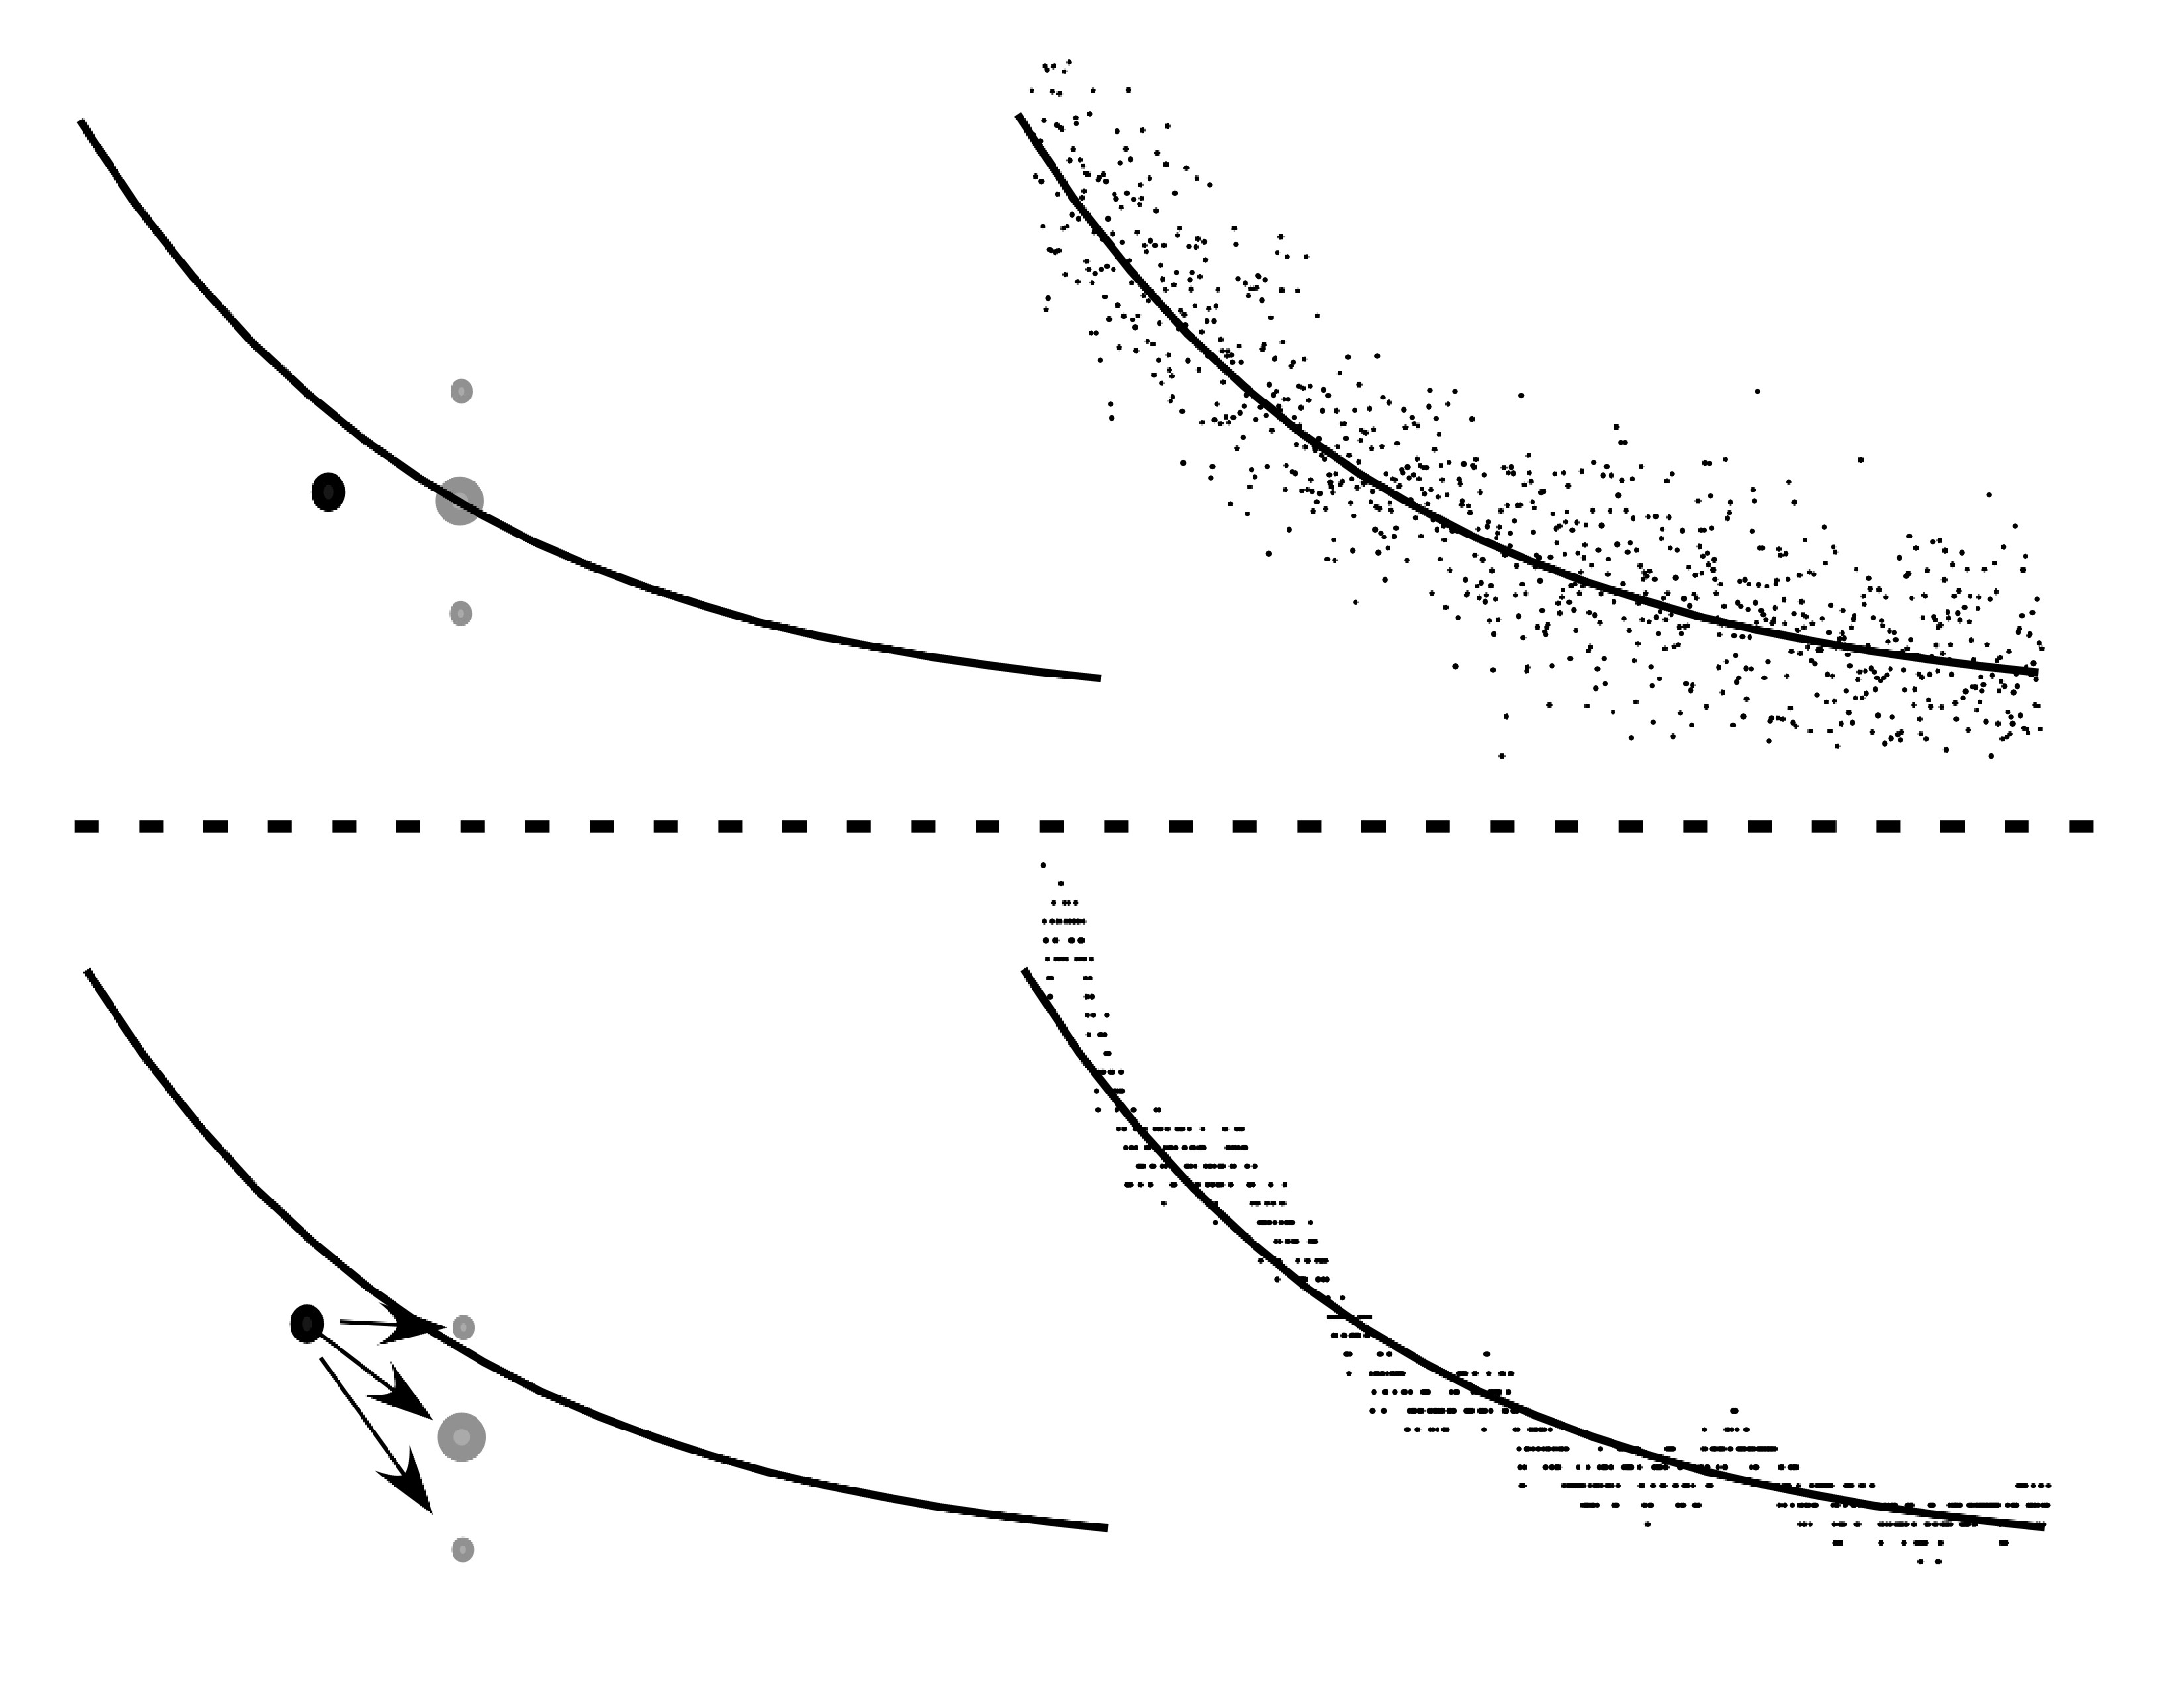 FIGURE ABOVE: Analysis of ion channel data typically involves curve fitting by sum of squares minimization. The actual data is compared to a smooth curve predicted by an exponential equation. Different parameters for the exponential equation are tested by adding up the square of the distance between the curve and each data point. The reason this method is so widely used is because when the noise is uniform and uncorrelated, sum-of-squares minimization is analogous to and has all the same power of maximum likelihood fitting. The example in the upper right shows what the data would look like if this were the case. The upper left panel demonstrates how, if the actual data were below the theoretical curve at a given point, the probability it would be above or below would still be the same at some later point in time. In fact this is not the case with ion channel data. If at a given point in time, more channels were closed than predicted by a correct model, this is more likely to still be the case at some short time later (lower left). This is clear comparing actual ion channel data (lower left) to uncorrelated noise (upper left). The correlation lead to covariance of the data and the CVF method takes advantage of this aspect of ion channel data. Please see Celentano and Hawkes 2004 (Feel free to contact me for a pdf) for a more detailed explanation of CVF.
A total of 5 patches were recorded with solutions containing 2 mM (physiological) Ca. Each patch was exposed to 5 different pH perturbation protocols 4 of which are shown above. These traces were fit using CVF to over 60 distinct thermodynamic models. Model comparison is done using the likelihood ratio test. This allows a systematic approach to ruling out one model relative to another. The same approach will be used to fit data recorded at high and low calcium to some of the same models. Results of this may lead to refinement of the fitting to the data recorded at physiological calcium.
Challenges
Ultimately what I am doing is like searching a large multi-dimensional space for a sweet spot, a place where the likelihood is a maximum relative to all other places I have tested. The approach is systematic, but can never be considered exhaustive. It will never be possible to say that I have tested every possible model. I will only be able to say that I have tested enough places to say that the likelihood of a better model is low.
Pre Analysis Plan
Thus far I have applied CVF extensively to the ASIC1a channel and in a limited fashion to 3 other channels. Results of the other 3 served to guide the models tested for ASIC1a. Once I am over this difficult period, I will be able to apply CVF to a wider number of channels. Because all ion channels are proteins and have presumably evolved from a limited number of earlier genes and evolved to serve a limited number of functions, I expect there will be a limited number of principal aspect of ion channels that will be common to large numbers of them.
Protocols
This project has not yet shared any protocols.