Methods
Summary
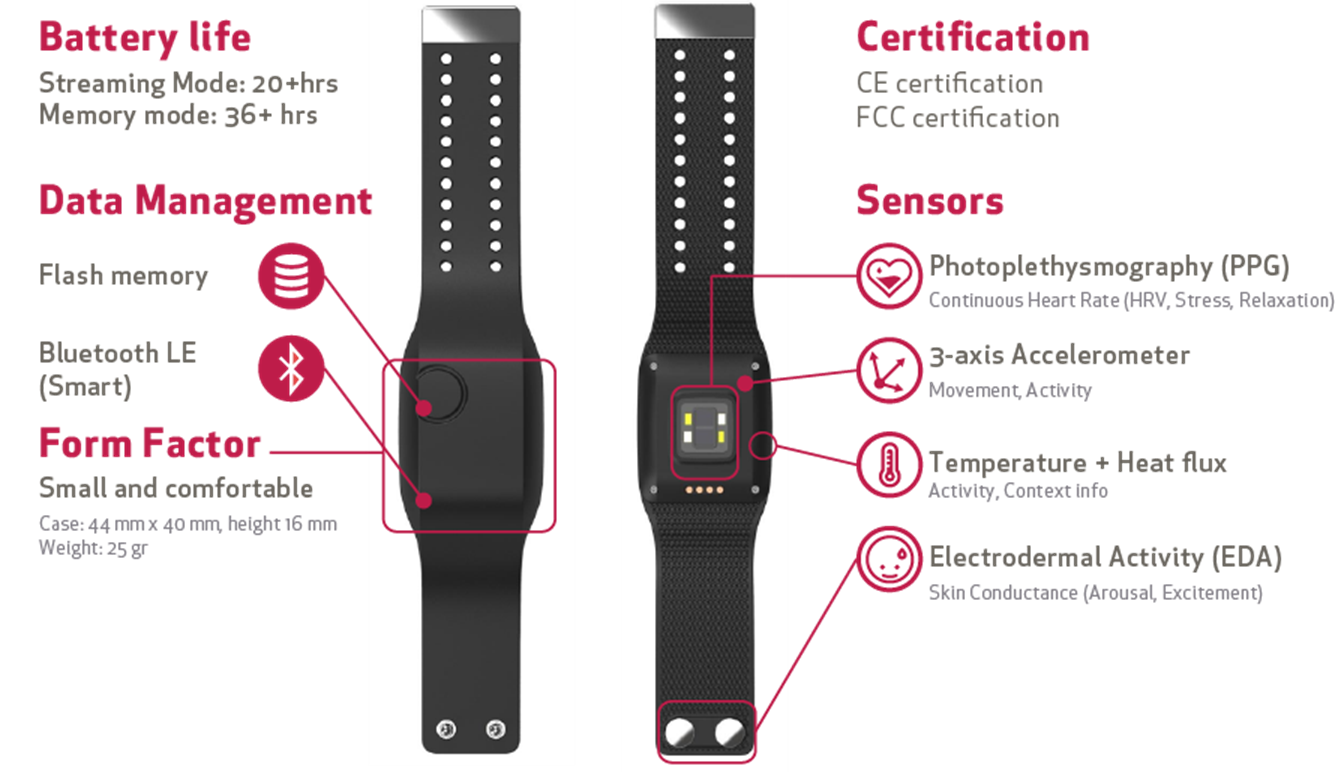
We will recruit infants starting around 3 months of age, for visits to our lab at 3.5, 6.5 and 9.5 months. Each visit is within a 2 week age window. The participants will arrive approximately one hour prior to the infant's regular nap time. After an introduction to our lab and the procedures, and signing of consent forms, we apply the autonomic E4 sensor, bilaterally, to the infant's calves. These research grade sensors record temperature, skin conductance, continuous heart rate, and movement (actigraphy). We record this activity from both legs, given recent evidence that skin conductance has an asymmetric pattern of activity, and therefore in order to capture these patterns bilateral recording is required. We use research grade sensors, so that we have complete control over the data collection and can get highly sensitive measures and high temporal resolution. Many consumer devices on the market today, lack this type of control and sensitivity, as well as the scientific understanding of the meaning of these signals.
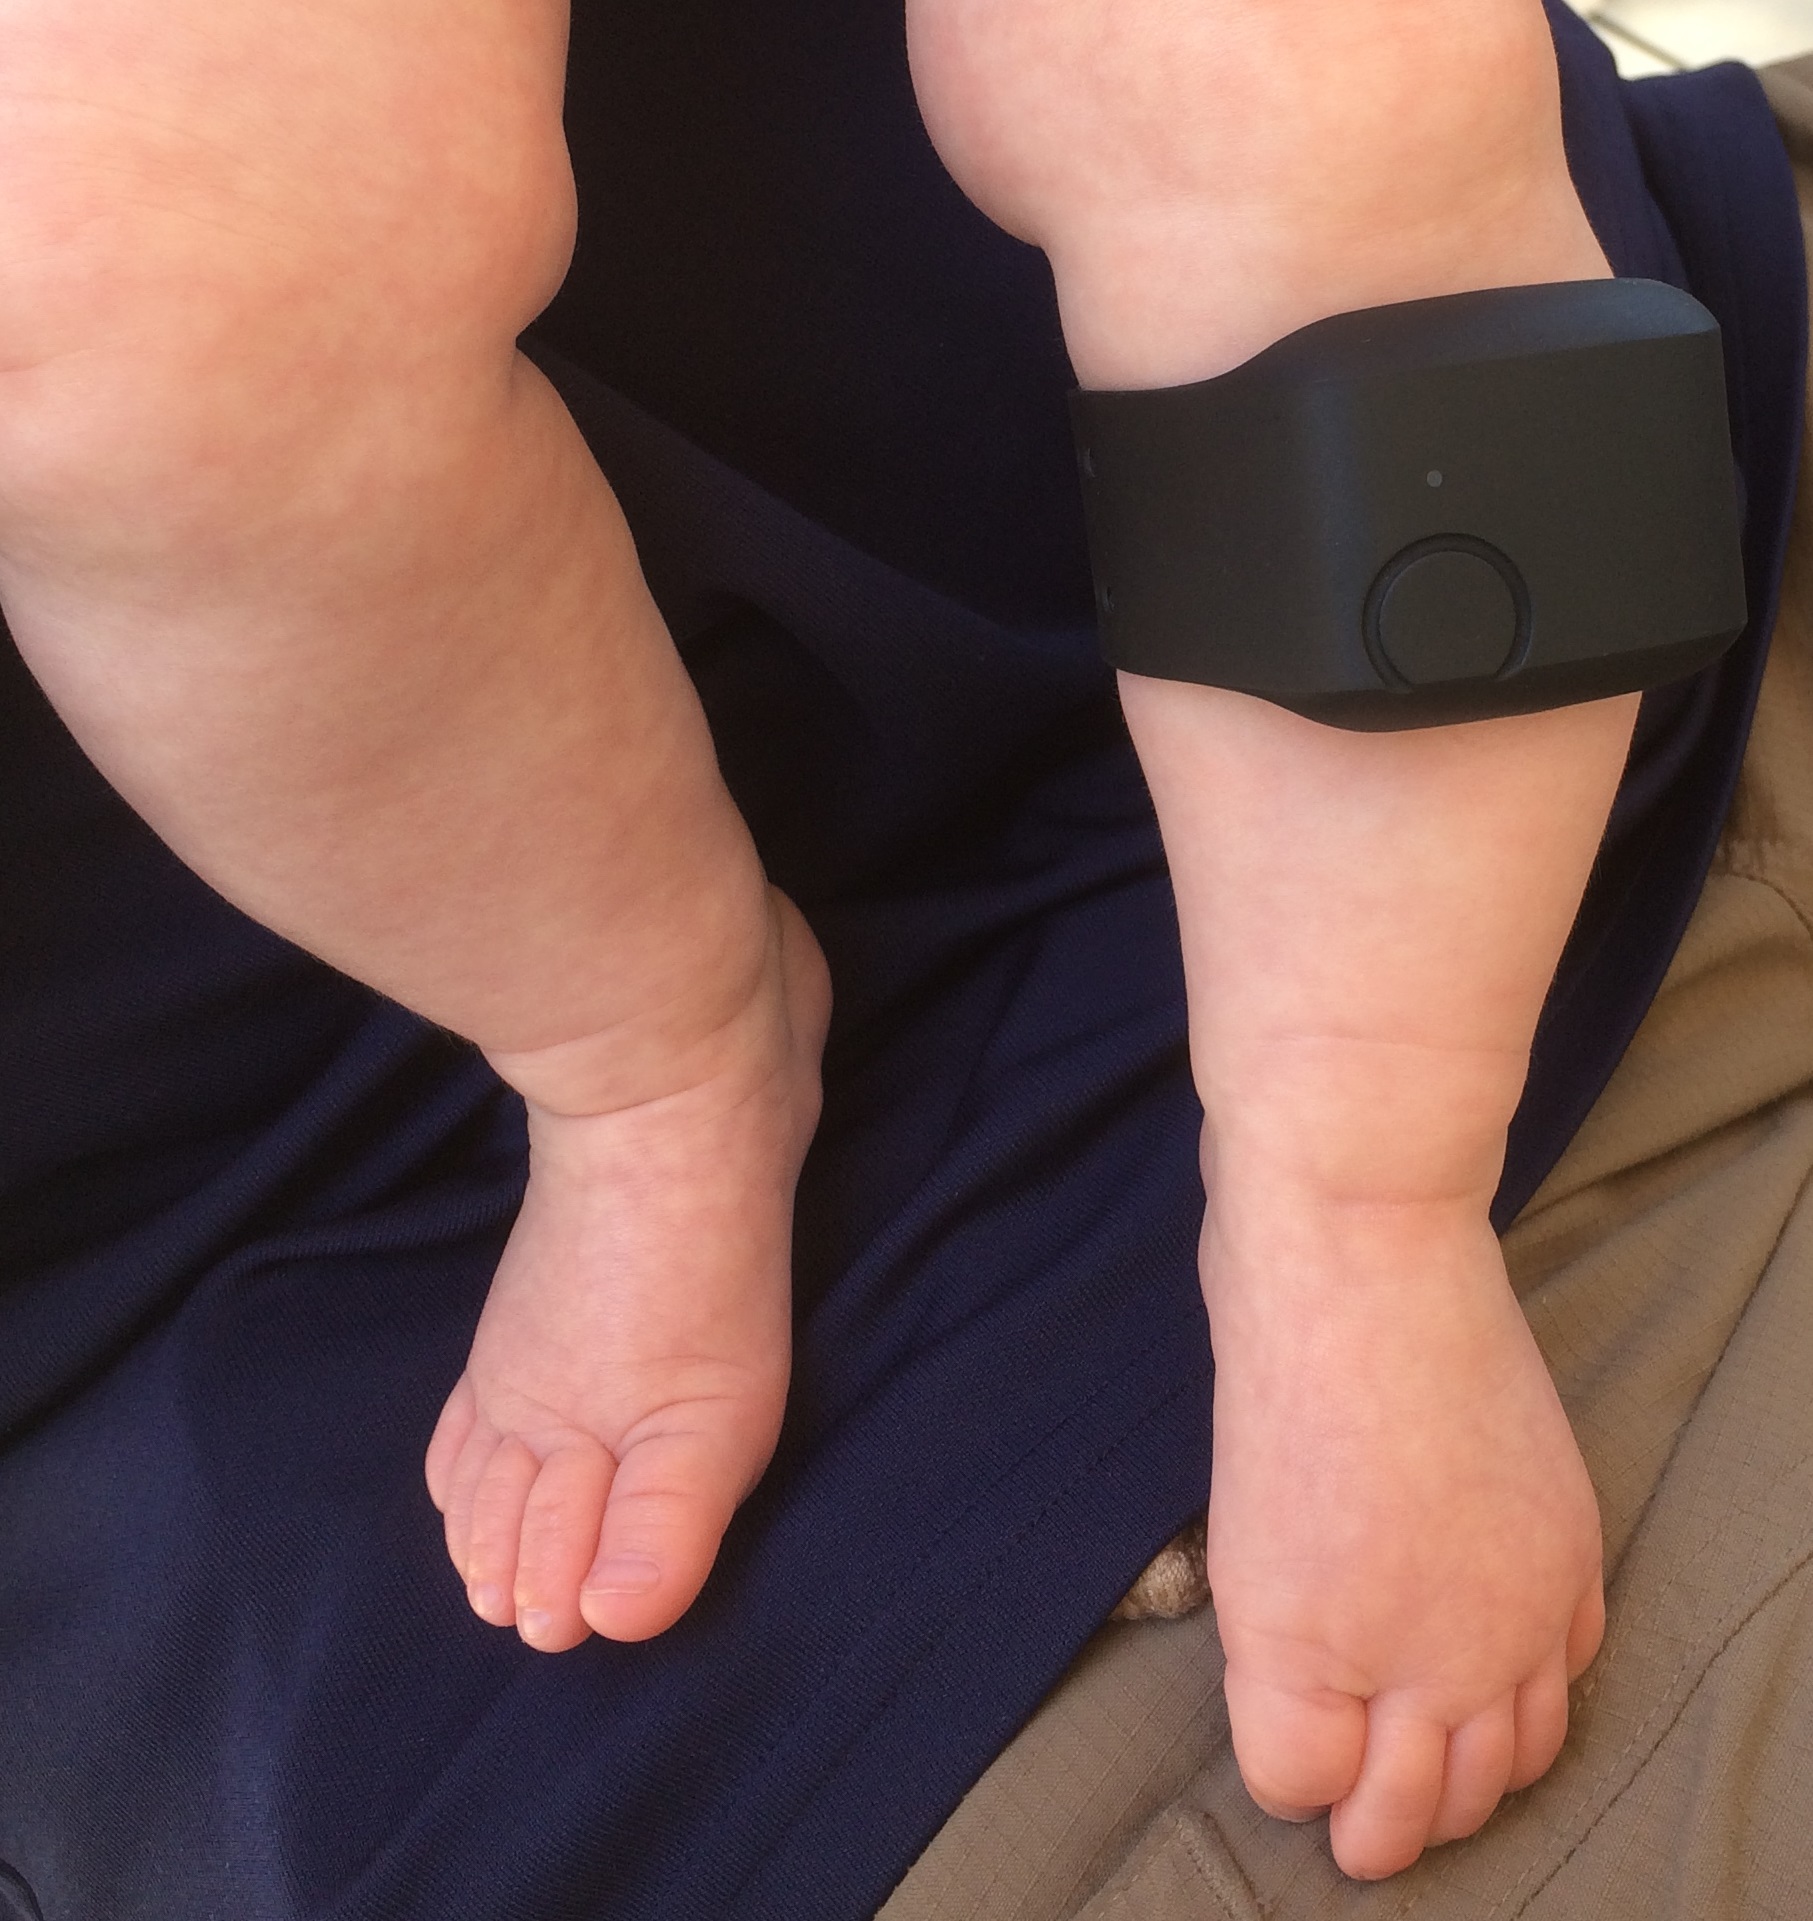
 Emaptica E4 Sensor, worn bilaterally on the infants' calves. EDA or skin conductance has been shown as a correlate of deep brain activity, and may serve as a biomarker for brain development during sleep.
Behavioral testing (at each visit): The parent and infant will participate in an individually administered standardized assessment of current developmental functioning, called the Bayley Scale of Infant and Toddler Development. This includes four domains of cognition, language, motor, and social-emotional scale. We also administer the Infant Behavior Questionnaire (IBQ-R), which is a standardized assessment of temperament and attention.
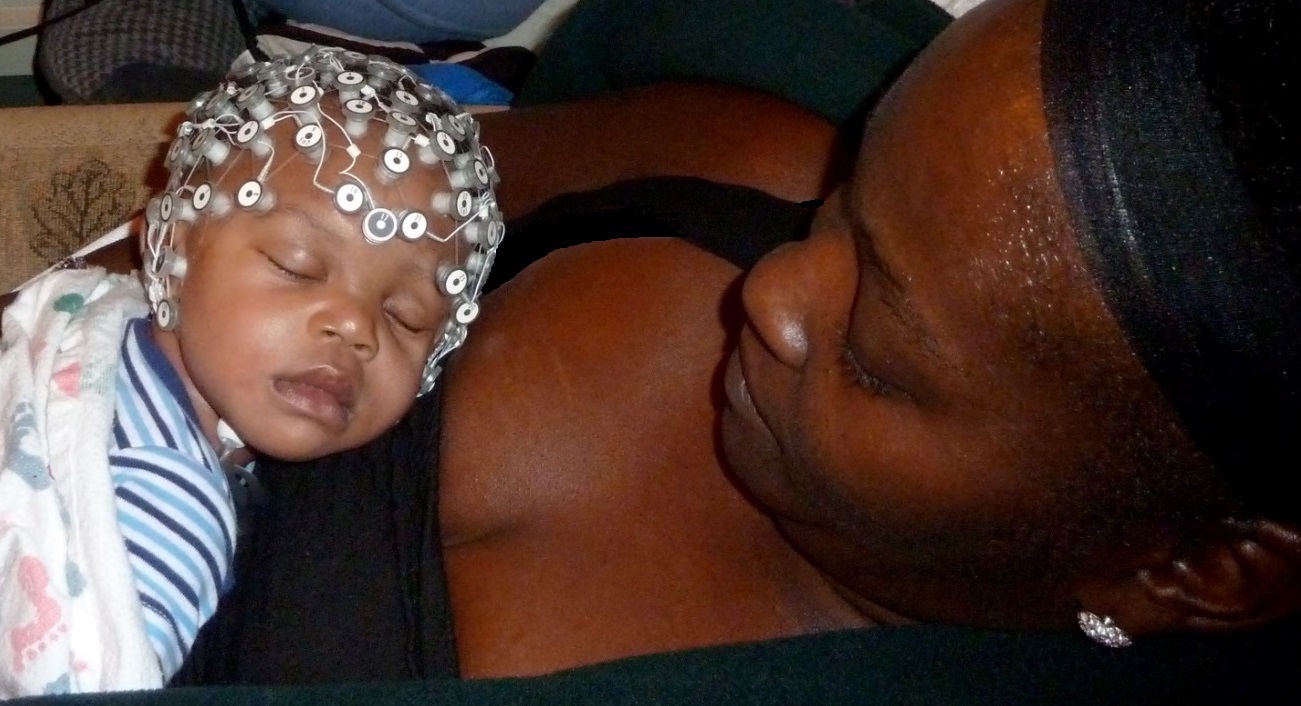
EEG Recording of Sleep: Following assessment, the infant is typically fed and then takes a nap for approximately 30-45 minutes. A 124 channel EGI Hydrocel net is applied, when infant is asleep in a car seat, on parent, or in a crib. EEG is sampled at 250 Hz and bandpass filtered online at .1 to 100Hz. The infant sleep behavior is monitored and recorded. The primary daytime nap sleep state at these ages is NREM, which is the focus of this study.
Two Customized Parent Questionnaires: (1) Current Sleep Behavior and Habits for information on diurnal and nocturnal habits; environmental factors of noise, light, and temperature; diet and medication, and if breast feeding, diet and medication of the mother (at each visit) (2) Family History Questionnaire which assesses variables related to socioeconomic status and risk status (i.e. family history of autism, ADHD, autoimmune disorders, language or learning impairment).
Challenges
Recruiting families to participate in research is challenging. Even with such non-invasive experiments as this, simply using passive sensors to record physiology during naturally sleeping states. By funding this campaign you can help us to continue our efforts in developing creative methods to encourage expecting, new, and repeat parents to participate. This campaign itself is one example of a creative method, for sharing this research. We have already recorded over 50 sleep sessions in our lab, so we know we are capable of completing this work. We just need additional sensors and participants, so that we can continue to study the development of these sleep rhythms (brain and body) in longitudinal populations.
Pre Analysis Plan
We have already tested several analyses methods on our cross-sectional data of sleep EEG recordings, and on a small sample of autonomic EEG sleep recordings. Our data analysis plan is as follows:
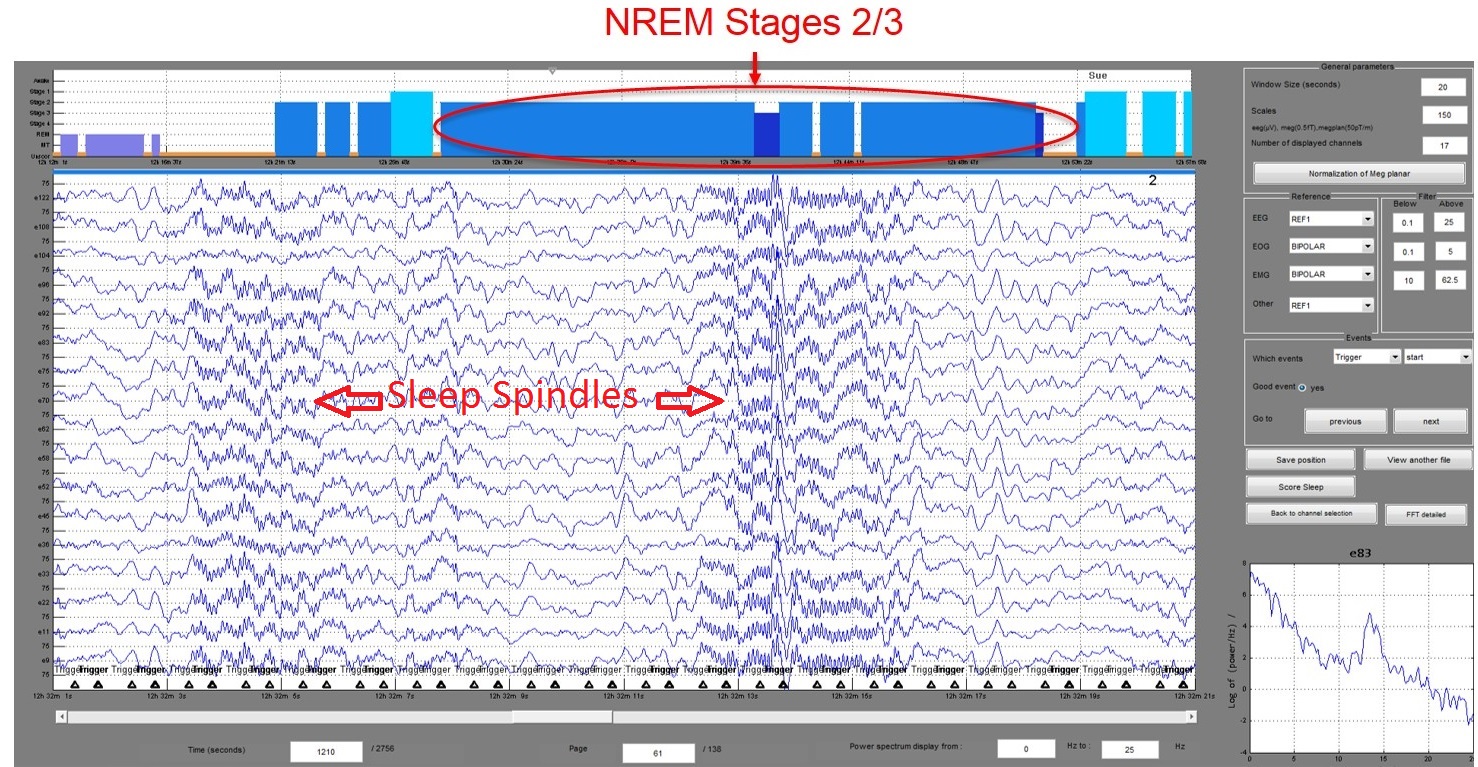
A two step process for data processing uses two different Matlab toolboxes. First, a sleep scoring toolbox (SPM/FASST) is used to delineate the macro sleep stages of REM and NREM, based on a subset of 10-20 system anatomically-mapped EEG channels and sleep behavior. Sleep scoring is based on 20-second segments. Then, using EEGLAB, artifact-laden channels are removed and interpolated according to channel statistics and visual inspection of all 124 channels.
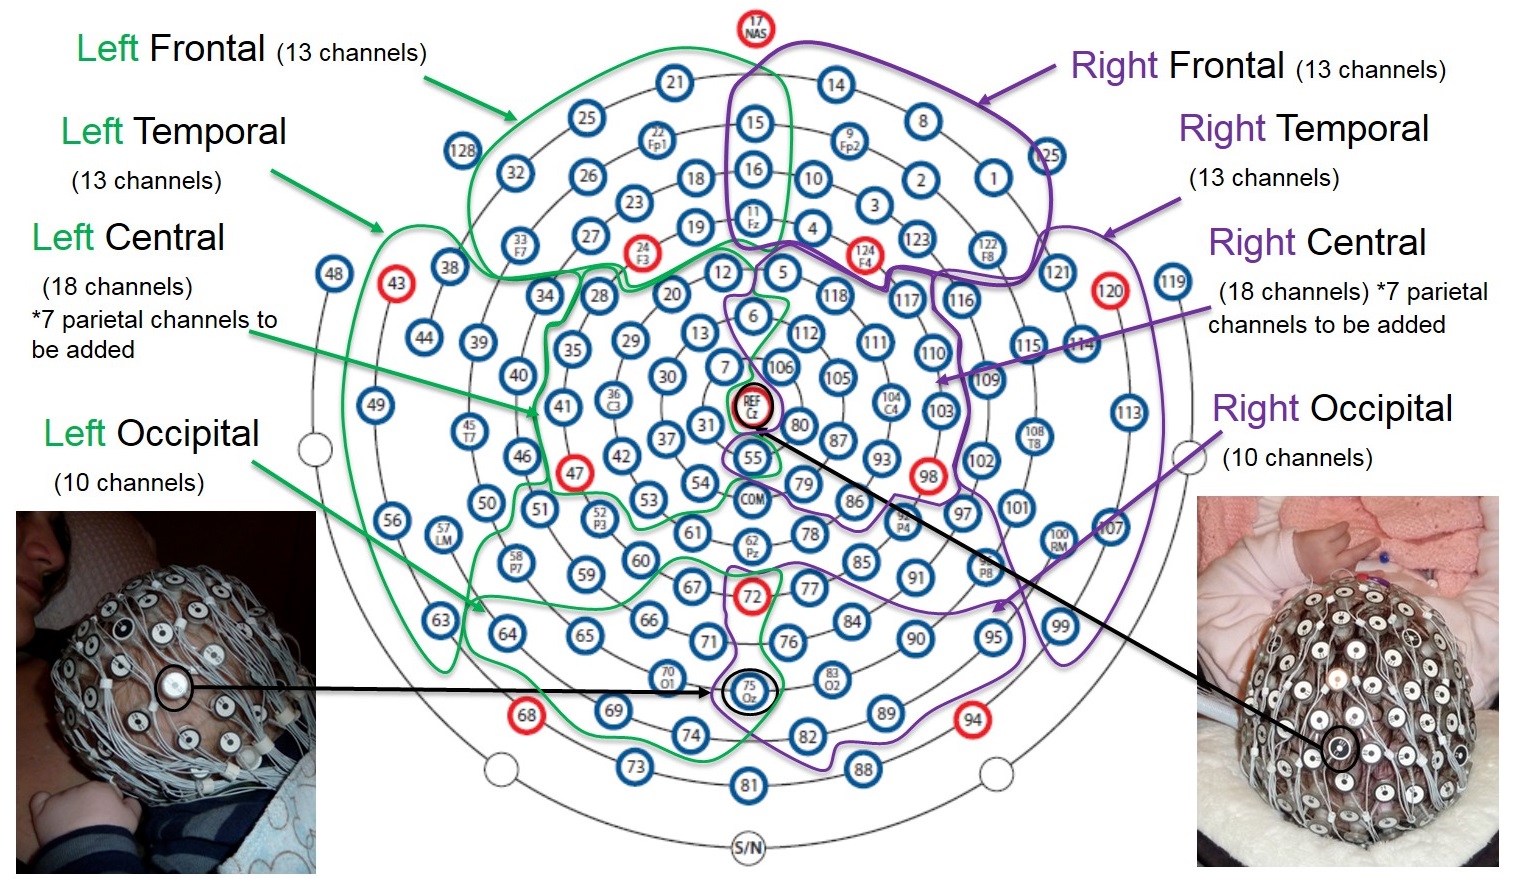
Selection of Topographic Clusters of Channels: The microstructure activity of interest is expected to be region specific. The EGI Hydrocel Sensor map, with the 10-10 anatomical mapping (red circles, figure 4), and our photos of the net applied to infants while sleeping, will be used to pick clusters of channels that are representative of four brain regions: frontal, temporal, central, and occipital. We will also use data-driven methods to define these clusters. A spectral analysis technique is applied to each of the 20-sec segments, for each channel, for each subject, and then averaged as regional clusters, across all EEG segments for each subject.
We will also use spectral analysis techniques to examine the topography of specific frequency ranges of interest. This is an example, of the spindle (sigma) frequency range, and is a group average of 3.5 month infants (on the left) and 6.5 month infants (on the right). From this plot we can see that the spindle activity develops with higher power from more central regions to both central and frontal regions, with maturation.

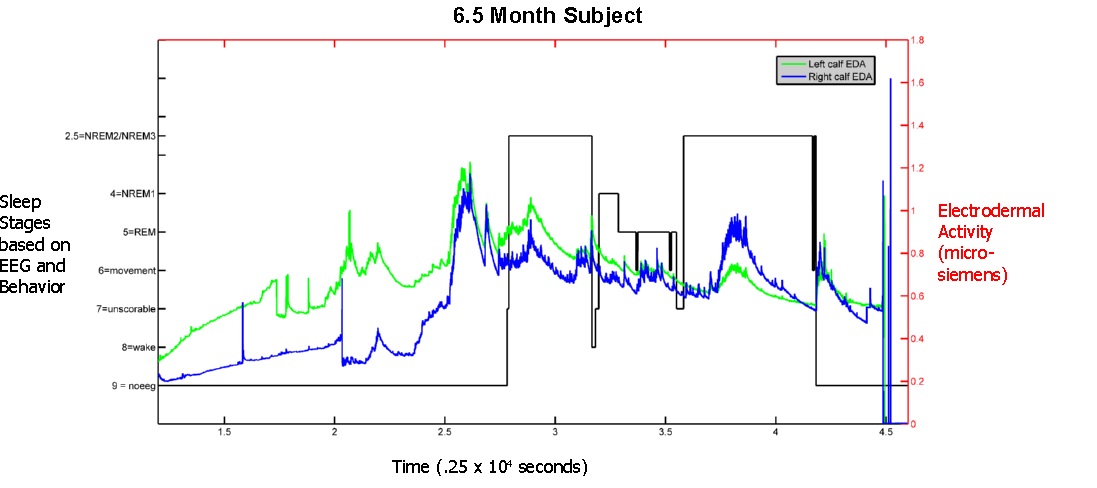
We will use Matlab to plot skin conductance, or EDA activity, with an overlay of our sleep scoring data. We are interested in the presence of EDA storms or peaks of this activity, which is thought to occur predominantly during NREM2/3 sleep (or concurrent with spindles and slow waves). To our knowledge, this activity has not been studied in infants during sleep, and few other groups are just now beginning to study this signal in infants while awake. In the below example, the period prior to sleep is the cognitive assessment session.
Various statistical methods will be used to examine the relationship between the topographical maturation of these components, behavioral scores from the assessments, and the results of the autonomic activity analyses.
Protocols
This project has not yet shared any protocols.