Please wait...
About This Project
We live in exciting times where commercial farmers are discovering the hope of healthy soils and they are using less commercial fertilizer than they would have imagined.
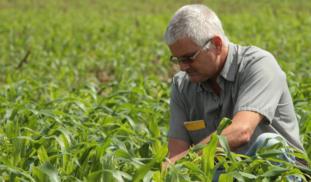
Our goal is to work with Carl Coleman, farmer from Dillon, SC to test how low we can go with commercial fertilizer as he grows a wheat crop this fall. This will be good for the farmer, his neighbors and for the environment.
Our goal is to work with Carl Coleman, farmer from Dillon, SC to test how low we can go with commercial fertilizer as he grows a wheat crop this fall. This will be good for the farmer, his neighbors and for the environment.

Browse Other Projects on Experiment
Related Projects
Worms at Work: Scoping Natural Carbon Sequestration at Scale
For centuries, scientists noted earthworms' exploits as ecosystem engineers. Recent research shows the feasibility...
Whales as oceanographers: Developing multi-sensor tags for improved understanding and management of critical habitats
Limited oceanographic data prevent accurate prediction of whale foraging hotspots. To address this, we will...
Communities perception and monitoring of ocean acidification in the Douala-Edea national park (Cameroon)
This project will help us to evaluate the vulnerability of clam fishing to ocean acidification (OA) in the...


