


Please wait...
About This Project
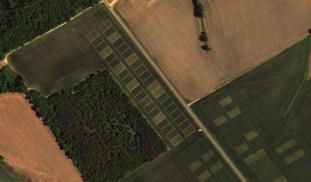
This is a follow-up project to our first experiment.com project "How much fertilizer do we really need?" where it was difficult to find any response to phosphorus (P) or potash (K) fertilizer inputs, suggesting that, in a healthy, cover cropped soil, legacy P and K may be untapped resources, while economic nitrogen rates seemed to be lower than initially thought. Soil test P in our 40 plots is in the "High" range, so we will concentrate on the effect of nitrogen and potassium in this research.
More Lab Notes From This Project

Browse Other Projects on Experiment
Related Projects
What factors affect the attractiveness of rivers to people?
Rivers are an important part of the natural environment. They provide habitat for fish, crayfish, insects...
Improving Soil Health with Oyster Industry "Waste"
Agricultural soils in The Gambia, West Africa, are highly acidic, which greatly reduces plant growth and...
No but seriously now, how much fertilizer do we really need?
This is a follow-up project to our first experiment.com project "How much fertilizer do we really need...