Gavin Edwards

Gavin Edwards

May 25, 2015

Group 6 Copy 187
1

Measurements of Ozone During the Heat Wave of 2012

Here at Eastern Michigan University, undergraduates form the backbone of our research teams. I have been lucky enough to have some great undergraduates working with me over the years and this Lab Note will highlight such group, Sarah Dolan, Aaron Trierweiler and Katelyn Cichon. These students have been specifically looking at ozone data from the calendar year 2012.

During 2012, one of the most intense heat waves in U.S. history enveloped portions of the western plains and Midwest. A persistent high pressure system, also called a "heat ridge" or "heat dome", was trapped by weather systems over the north Atlantic in June and July 2012. This caused many States to experience record temperatures . Although not unusual in the summer, the pattern of hot air covered a broader area than usual and the total amount of hot air was greater. In addition to enabling the basic chemical reactions that create ground-level ozone, high temperatures often create stagnant air conditions that cause ozone pollution to settle over an area and remain for a longer time, which in turn increases the potential for human exposure to harmful ozone concentrations. Clearly the persistent heat dome of 2012 fell into this category and offered a unique opportunity to investigate ozone on the EMU campus during this event.

Effect of heat dome on national temperatures in 2012

Data were analyzed in two ways. First, the data were broken down into 24-hour cycles and the average ozone for these data calculated from March to October. Then, the maximum ozone for that day also determined. Data were then worked up to monthly averages and compared to similar averages from 2008-2011. Finally, master 5 year averages were determined. 24-hour averaged ozone concentrations for 2012 were found to be consistently higher than those measured as a 5 year average, both overall and especially during the summer months.

Average monthly ozone concentration in 2012 compared to 5-year average

The 2012 data appear to be similar to 5-year averages for the month of March, but show a steady increase in summer where the deviation between 2012 data and the 5-year average is seen in May-September the times associated with peak in situ ozone production. Comparing these deviations with the standard deviation of the 5 year average, it appears that the 2012 concentrations differences are statistically significantly with June and July 2012 (times associate with the largest impact of the heat wave) showing around 10ppbv differences. Similarly, the maximum ozone concentration measured in month shows 2012 to be larger (by a statistically significant amount) when compared to the 5-year average. Again, the deviation begins in early Spring and peak in Midsummer.

Peak monthly ozone in 2012 compared to the 5-year average

A record ozone concentrations measured in June 2012 was also seen as this month. The peak ozone value of ozone was 110.3ppb, compared to a 5 year average of has average of ca. 80ppbv during June.

1 comment

Join the conversation!Sign In
  • Oscar Jasklowski
    Oscar JasklowskiBacker
    This is cool! You mention ozone tends to settle, especially when air is static. Is this why it's important to get a vertical measurement?
    Jun 10, 2015
  • Gavin Edwards
    Gavin EdwardsResearcher
    Hi Oscar. Thanks for the interest and of course, the pledge! We are happy to have you as a formal backer of the project. Ozone can "settle" as you put it but it is more like being trapped in a bottle by things like the heat island we talked about in the lab note. The hot air cannot go anywhere and hence, ozone and ozone precursors build up and up leading to very poor air quality. This is similar to what happens for example, in Salt Lake City when temperature inversions trap air-masses close to the city, where, they become heavily polluted. A ground based sensor will give readings on the ground but, ozone aloft can be significantly different depending on the chemistry and dynamics of the elevated air. Hope that answers your question! Best wishes, Gavin.
    Jun 11, 2015
  • Oscar Jasklowski
    Oscar JasklowskiBacker
    Got it, thanks Gavin! 3 quick things: elaborating on my original question, if air is static in the xy direction (because of a heat island, say), can ozone and other molecules still move in the z direction? This is what I meant by 'settling.' If they can move in the z direction, then I can see why measuring the ozone concentration all throughout the vertical column over time would be really cool (e.g. maybe you could predict that ground air quality will get a lot worse before the heat island dissipates). Second thing: thanks for touching on the inversion in Salt Lake (I lived there for a little while and saw a few of these first hand). I didn't realize this was because of the heat island effect. Because it's so cold inside an inversion, I didn't connect the two things. I imagine the mountains on all sides make it a little easier for the heat island to form? Last thing: any light reading you'd recommend on heat islands and other atmospheric phenomena? Thank you!
    Jun 16, 2015
  • Gavin Edwards
    Gavin EdwardsResearcher
    Hi Oscar. Motion is possible still in all three directions up to the 'lid' that is the inversion. You are right about the mountains as any time there is cool air sitting on warm air, there is in effective lid on the airmass. This happens in SLC and also Denver and of course, most famously in LA and going back further, caused the Donora, Pennsylvania disaster. There is lots of things online about this stuff these days and if you want a free textbook on all things atmospheric I would recommend Daniel Jacobs book that you can download free at this URL: http://acmg.seas.harvard.edu/people/faculty/djj/book/
    Jun 17, 2015

About This Project

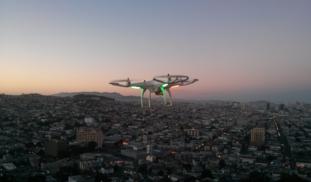
Many people living in or near large cities are subject to poor air quality. Cities like Detroit are among the top ten most polluted in the USA with respect to particulate matter and ozone. The focus of this project is the development of a gas sensor array that will measures toxic gases. We will attach the array to a commercial "drone" to build vertical atmospheric profiles of pollution in the urban area surrounding Detroit, Michigan.

Blast off!

Browse Other Projects on Experiment

Related Projects

What type of microplastics and chemicals are corals in the Pacific eating?

Coral reefs provide important cultural, economic and ecologic resources. These important ecosystems are...

How much of recyclable materials are we throwing into the trash at the University of South Carolina Beaufort?

The University of South Carolina Beaufort only supports paper recycling for waste generated by a 2,100 student...

The Cookie Monster: How does the type of sugar affect different cookies?

Sugar has an impact on baked goods that goes far beyond sweetness, influencing texture and spread as well...

Backer Badge Funded

A chemistry project funded by 34 people

Add a comment