Statistical Analysis

In the picture above the colored lines represent a statistical procedure called changepoint analysis that breaks the data into chunks where the average is stable. We can then compare these stable averages to the water samples we have to figure out where a fish was during that portion of their life. To do this we use a statistical technique that classifies the stable signatures from the fish into groups defined by variation in the water samples. This technique is called discriminate function analysis.
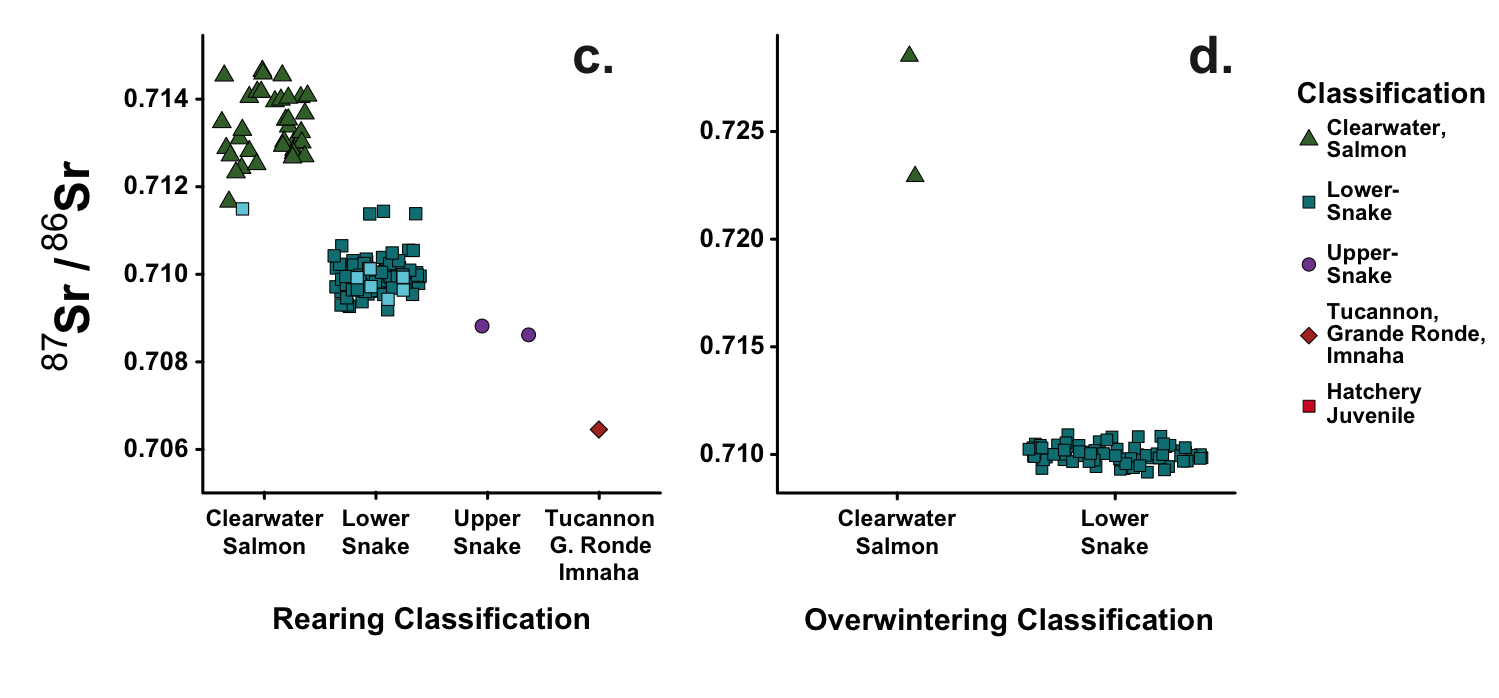
This plot from one of my papers on salmon illustrates how we can classify the location of a fish based on their chemical profile.
This classification is where the "Secret Decoder Ring" of the water samples meets the secret message written in the otoliths. Once we've classified the otolith signatures we know where the fish was at each period of it's life. We can also compare the place with how fast the fish was growing, or how long it spent there, to infer even more about the why and how of a fishes migration.
- Published on Mar 30, 2016
- 13 views
- 0 comments
- Print this page
- Back to Methods