Methods
Summary
Cameras will be deployed four times a year in January, April, July, October to capture seasonality. Cameras will be set out on the first of these months and collected after 30 days. The same 10 camera locations will be used each deployment. Trees will be marked with flagging tape so that the cameras are placed in the same exact spot each time. There will be a mixture of cameras in the primary and secondary growth areas of the preserve. Cameras will be set near walking trails since these often serve as corridors for wildlife. 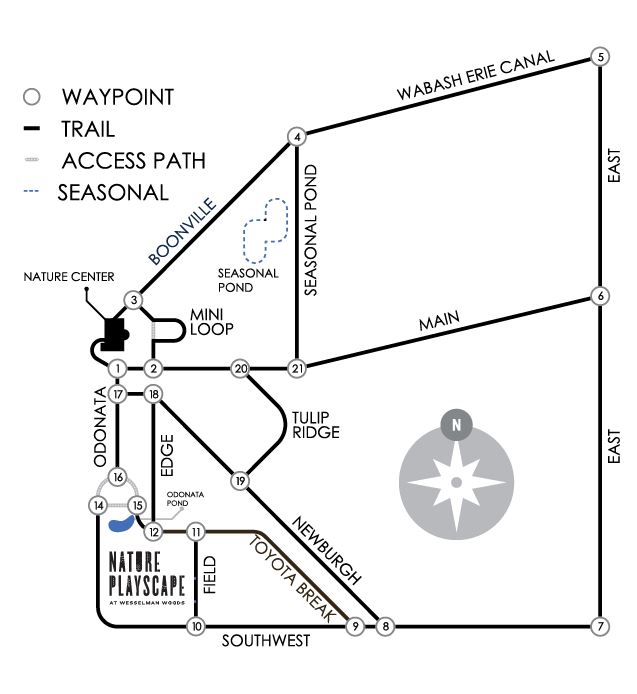
Challenges
Possible project challenges include not having enough manpower to go through data in a timely manner. Often times there are too many pictures after one deployment to tag before the next influx of photos. The plan is to gauge interest at local universities and environmental organizations for students to intern/volunteer and tag photos ahead of time. Having some sort of consistent tagging set-up will help at the least.
Pre Analysis Plan
Once each photo is tagged, it will be sent to an excel database that will take the date, time, location, and species information onto a sheet. That data can be turned into graphs or sent into R for statistical analysis. An ANOVA and Tukey test can be used to identify statistical differences between sites, locations, species, etc. Using R to model occupancy at various locations will also be a useful tool for visual representation.
Protocols
This project has not yet shared any protocols.