Methods
Summary
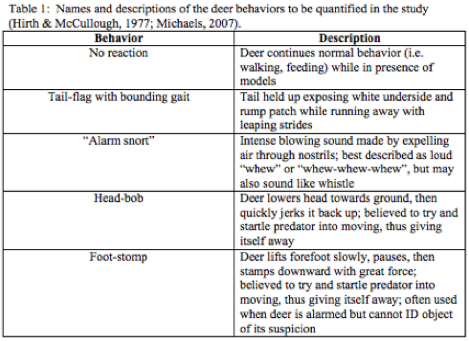
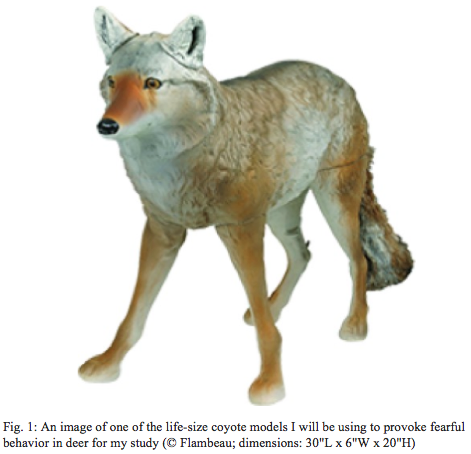
This research will use 3D models of coyotes (Fig. 1) as well as samples of their scents (i.e., urine as a topical spray) to observe the reactions of the white-tailed deer surrounding the Blue Hills Reservation. Trail cameras will be used to capture deer behavior, as well as the number of deer that enter the selected backyards, and their time spent in the locations. My null hypothesis is that the presence of coyote models will not increase the number and frequency of fearful behavioral reactions (Table 1) of white-tailed deer in suburban backyards.

If the deer react with fear toward the models as expressed by the behavioral cues listed above, then an additional element in deterring deer from residential backyards (besides fencing, which can be seen as an eye-sore in terms of real estate) can be used to better manage (garden/ornamental damage by) this over-abundant population. With permission from local residents, a trail camera will be set in their yards, and additionally, the coyote models and urine samples.
In total, six yards will be used for this study over six weeks. Each week, one yard will serve as the “control yard” (with only a camera, and no coyote models or urine), and another yard will serve as the “experiment yard” (containing a camera, the coyote models, and urine). At the end of each week, the SD cards will be collected and the cameras and models will be moved to two new yards. In order to collect more samples of data, as well as to account for any variables that could interfere with data interpretation, the cycle will be continued until each yard has been used for a control yard in one week, and an experiment yard for one week (Table 2).

Permission from the landowners will be obtained prior to beginning the fieldwork.

Challenges
A couple of challenges that come to mind when working on this project include homeowner willingness to allow the study to be conducted in their yards, as well as the possibility that the deer may not react fearfully to the coyote models. To overcome the former challenge, I will be mailing out flyers and a cover letter to residences on selected streets near the Reservation (in particular, streets bordered mostly by forest habitat). Should more than six volunteers come forward to offer their residence for my study, I will remotely view all of the offered yards via Google Maps to note any factors such as physical structures (e.g. swimming pools), and possibly yard size/shape, to narrow down my choices to be as similar as possible.
For the latter challenge, should the deer either not react fearfully to the coyote models whatsoever, or adapt to them over the study period after initial weariness, then this will not only show that predator models combined with urine samples alone are ineffective in deterring deer from residential yards, but further demonstrate the species' remarkable adaptability to their surroundings. Additionally, this may also indicate that some lethal action may have to be taken to better manage over-abundant white-tailed deer, despite backlash from some members of the public.
Pre Analysis Plan
There is one hypothesis that will be tested in this study. My (null) hypothesis is that the presence of coyote models will not increase the number and frequency of fearful behavioral reactions (i.e. tail-flagging with a bounding gait, “alarm snorts”, head-bobbing, foot-stomping, Michaels, 2007) of white-tailed deer in suburban backyards. If the deer react with fear towards the coyote models as expressed by the behavioral cues listed, then an additional element in deterring deer from residential backyards (besides fencing) can be utilized to better manage (garden and ornamental damage by) this over-abundant population.
In terms of data analysis, the behaviors will be counted either on a yes/no basis, or numerically by their frequency of occurrence on each day—whichever of the two depends on the data collected during the fieldwork period. Along with the behaviors to be observed at the experiment yard(s), the number of deer that approach the models will be statistically quantified over a temporal scale (i.e. whether the number of deer and each reaction-of-interest increase, decrease, or remain relatively equal as time goes on), and grouped based on behavioral cues normally expected to reflect anti-predator behavior.
Furthermore, in order to collect more samples of data, as well as to account for any confounding variables at the yard level, all yards in this study will be used as both yard types over the duration of the fieldwork (i.e. if week 1 utilizes yard 1 as the experiment yard, and yard 2 as the control yard, then in week 4, when this particular set is used again, yard 1 will be the control yard, while yard 2 will be the experiment yard). Finally, previous studies have separated the deer into age (Lingle & Wilson, 2001) and sex groups (Hirth & McCullough, 1977). For my study, I will separate the deer based on sex as an additional means to evaluate the relationship between deer behavior and the presence or absence of coyote models.
With regard to how the data will be statistically analyzed, a mean amount of time and standard deviation will be calculated, and a two-tailed t-test will be performed to compare the two treatments. Furthermore, both chi-squared (χ2) and ANOVA tests will be performed, and contingency tables will be made, to discover if any variation in my data is due to chance, or due to the presence or absence of the models.
Protocols
This project has not yet shared any protocols.