Methods
Summary
Materials and methods (unfinished)
This project monitors three hives (of different types) at three different locations. The hives are not equipped with ‘supers’ and interventions in the cabinet are restricted to a minimum, so that the bees can develop in a natural way. It is important to give the bees a chance to divide brood, pollen and nectar over the combs in the most natural way possible.
Interventions are limited to a control once a week. During the interventions a number of parameters are checked:
- Queen's Presence
- Presence of queen cells or emergency cells (swarm tendency or queen dead)
- Quantity of breeding (in cm² comb surface)
- Quantity of pollen (in cm² comb surface)
- Amount of nectar (in cm² comb surface)
In order to investigate the link between food supply and growth of the colony there are three measurements required:
- Accurate measurement of foraging activity.
- Accurate measurement of daily food - pollen and nectar - supply.
- Real-time weighing of the entire hive.
RFIDs (Decourtye et al., 2011; He et al., 2016) have a few drawbacks that prevent a very accurate measurement of feeding activity: they are glued to the thorax of workers and therefore some workers must be anesthetized, which entails an interruption of foraging activity, and the aging of the workers (by CO2 anaesthesia). Moreover, foraging bees will only live for a maximum of three weeks, and therefore, tags should be replaced regularly.
Forager counting on regular intervals also has disadvantages. Observations are carried out for a short amount of time (5-10 minutes) because longer periods will impede on the researchers attention. Counting can also be omitted because of external factors (i.e. bad weather…). And the fewer the counting intervals, the lower the precision of estimation (Eckert, Winston, & Ydenberg, 1994).
With a number of ports (Fig. 1), placed in front of the bee entrance opening and within each port two IR-sensors, each incoming or outgoing worker can be detected at any time of the day (Hudson, 2012). The bottom of each port is provided with a mini load cell (Fig. 2)("S100 0.2N Data sheet," 2000), so that the weight of each passing worker bee is measured. The weight difference between incoming and outgoing workers gives an idea of the amount of material being introduced every day.
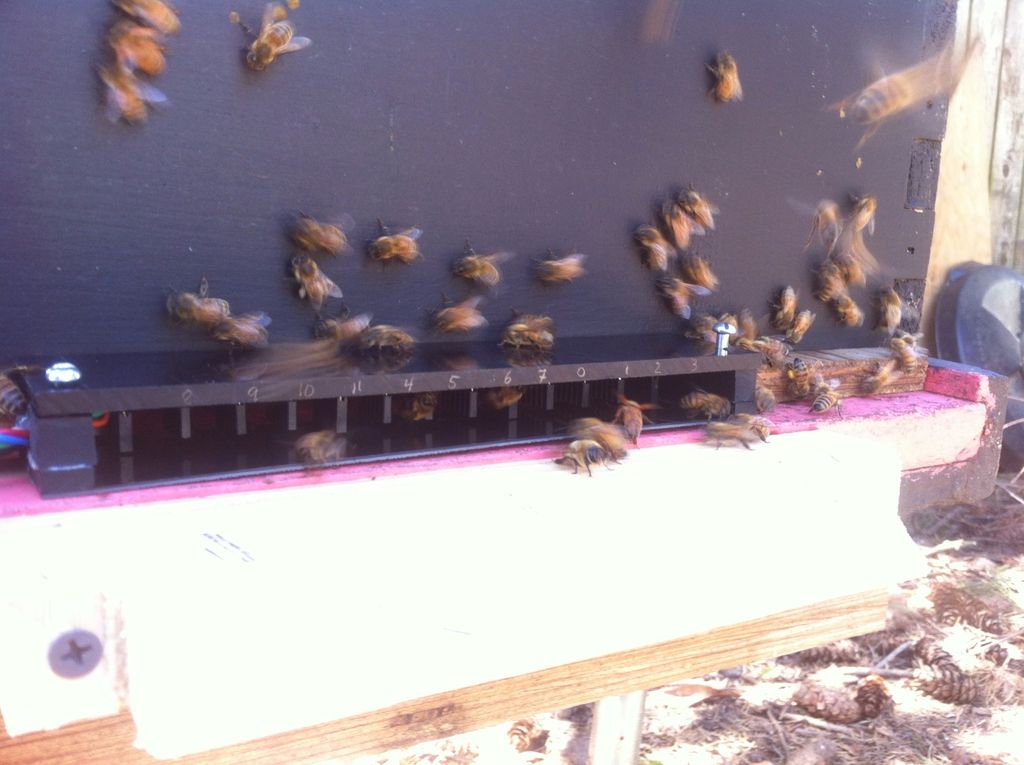 Fig. 1: Bee Counter gates
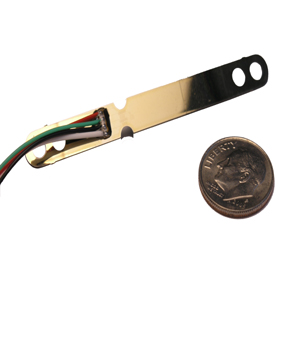 Fig. 2: Load cell
IR sensors and load cells are connected to Arduino Mega microcontroller, which sends the measurement data over the GSM network to a Google Drive account. The comparison and processing of the data is carried out by a raspberry Pi, which also serves as a CPU for a small weather station in the vicinity of the cabinet.
At the start of the study the empty hive is weighed. A constant weighing of the occupied hive gives a complete picture of weight changes in bees, brood and food supply. The difference between daily incoming food supply and total daily weight gives an idea of the amount of biomass - brood and bees. Here, however, conversion of nectar into honey, and the accompanying loss of water, must be taken into account.
Temperature is measured at different points (when possible 9 points per comb) in order to assess size and location of brood. Placement of sufficient temperature sensors (thermistors) can visualise a three-dimensional picture of the brood. However, putting more sensors would not necessarily give a better picture, would require more complex programming (Becher & Moritz, 2009) and can hinder bee activity in the hive.
When left undisturbed – no supers and no queen lock – honey bees always fill the combs in a characteristic way: brood in the center, with a band of pollen surrounding it and honey at the outside. (Fig. 3). With this information, the temperatures and the visual inspection, the proportion of the brood in relation to total weight of the colony can be calculated.
The rest of the combs is then believed to contain honey and pollen, and their proportion can be derived from previous calculations. The remaining part of the weight is then biomass: bees.
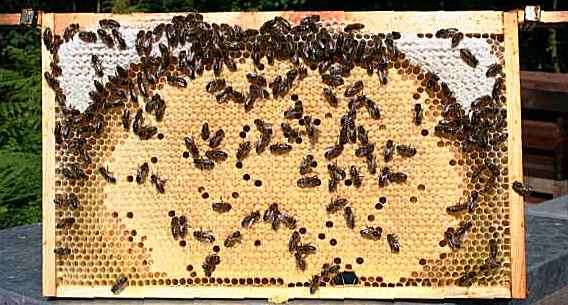
Fig. 3: Comb with brood and honey
There is also a positive, direct correlation between brood size and colony size (Allen & Jeffree, 1956). This can either be confirmed or used in calculating brood or worker force size.
Temperature measurements will also give an idea of the evolution of brood size throughout bee season.
The metabolic activity of the colony can be assessed based on oxygen consumption and CO2 production . To measure oxygen consumption, an additional opening is provided in the hive (top). There, an oxygen sensor as well as a CO2 -sensor are mounted. By means of a small fan, air is drawn out of the hive for a short amount of time, several times a day. An additional CO2-sensor is mounted at the hive entrance.
The difference in CO2 and O2 concentrations is a measure of metabolic activity of the colony.
Challenges
Expected challenges
1. Programming.
Programming IR sensors and load cells, in order to connect individual weights to entering or leaving bees will be challenging. Data must be received simultanously in order to connect food supply weight to foraging behaviour.
2. Bees.
Bees are animals and in such a way unpredictable. Weather conditions, flower diversity in the vicinity of the hive (> 3 km) and possible diseases can all influence colony fitness and behaviour.
Protocols
Browse the protocols that are part of the experimental methods.